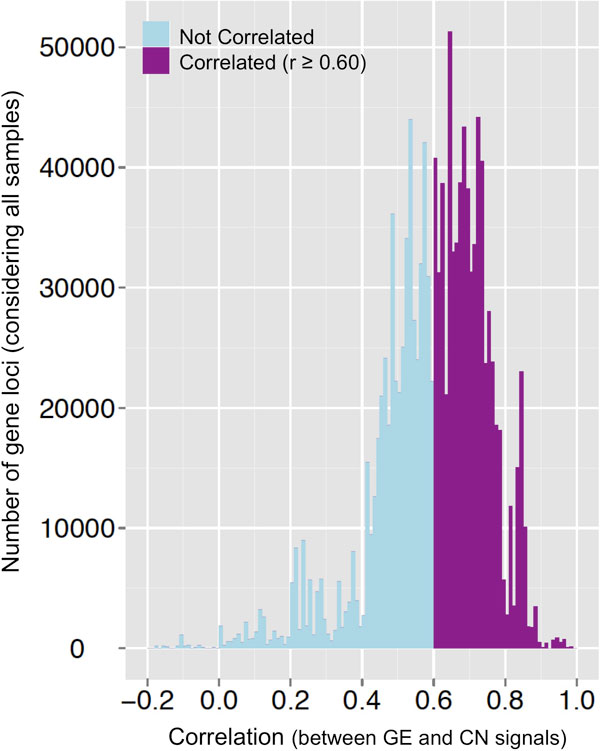
Figure 1.
Density distribution of the correlation coefficients between GE and CN for the GBM dataset. Purple represents the number of gene loci that present significant correlation (r ≥ 0.60) between gene expression and copy number signals, counted considering all the samples. Blue are the rest, not considered significant.

