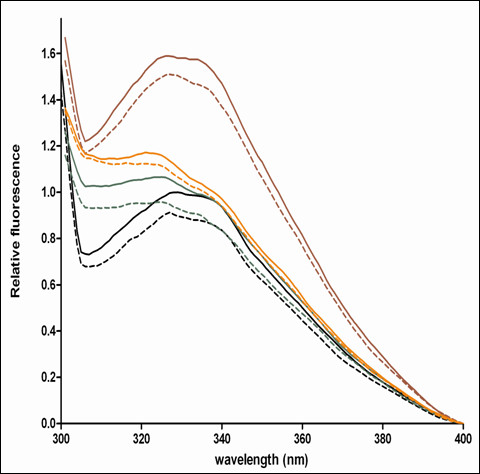
Figure 7.

Representative relative tryptophan fluorescence spectra of purified Gtr1 wild-type (black), Cys-less (red), Arg37Cys (green) and Val67Cys (orange) proteins in the GDP (full line) and GTPγS (hatched line) states. Data are representative of two replica experiments.
