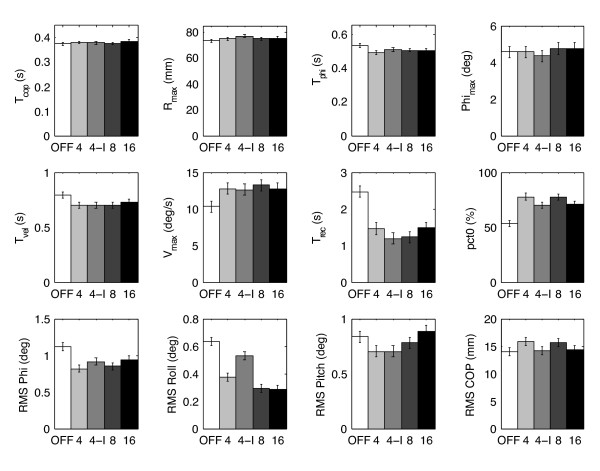
Figure 5.
Variation of parameters (see text for detailed description) across display configurations. Error bars indicate standard error of the mean. The four configurations with the display on (4, 4-I, 8, 16) show few significant differences amongst themselves, but are each significantly different from the display OFF case for Tphi, Tvel, Trec, Vmax, pct0, and RMS phi.

