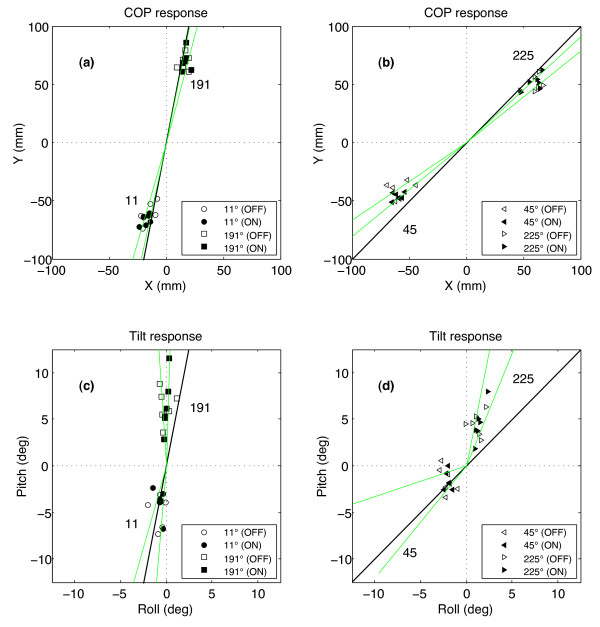
Figure 6.
Peak COP and tilt excursions for non-cardinal perturbation directions. Mean values are shown for each subject with the display off (open symbol) and on (filled symbol). Green lines indicate 95% confidence intervals of the mean angles (Acop and Aphi) for each direction and black lines mark the directions of platform motion.

