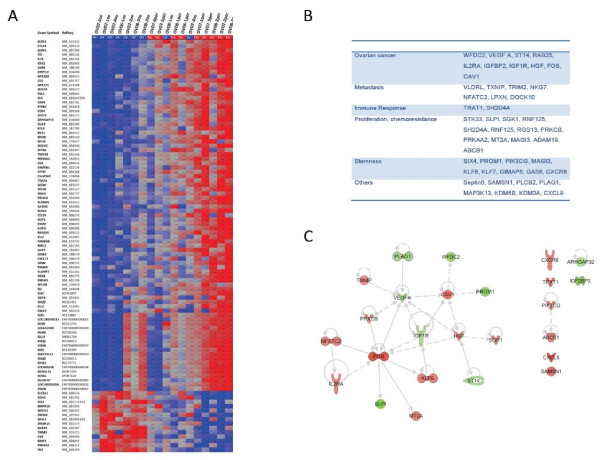
Figure 1.
A. Clustering of Tumors based on genes differentially expressed between ovarian primary tumors and their matched peritoneal metastasis. A fold change cut-off of 2 was used. Normalized Signal intensity levels are plotted for each tumor type at genes differentially expressed between the tumor types. The Primary tumor was used to create a baseline average. Patient IDs and tumor type are displayed above the plot. Red: overexpression, Blue:Underexpressed. Ov: ovarian tumor, Pe: peritoneal metastasis. B. List of most relevant genes associated to neoplasic disease. C. A network representing all genes implicated in the “cancer” category is represented in Figure 1C and demonstrates the central role of IGF, VEGF, CAV1 and FOS.

