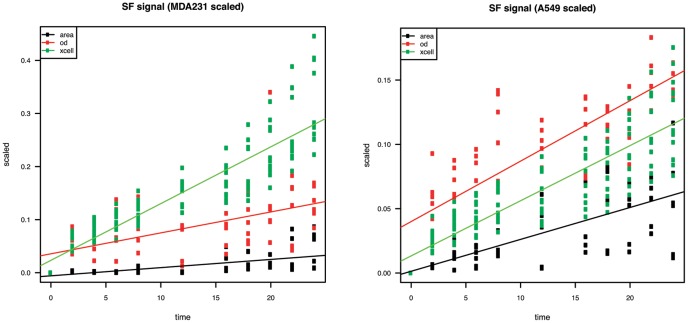
Figure 5. Time-dependent random migration profile of MDA-MB-231 and A549.
Comparison of random migration signals (negative control – SF) between three quantitation methods: pixel area calculation – black, OD - red, xCELLigence - green. A likelihood ratio test revealed a significant difference in slope between area calculation and OD (p<0.001) and area calculation and xCELLigence (p<0.001) for both cell lines and OD and xCELLigence (p<0.001) for MDA-MB-231 only. OD and xCELLigence slopes did not differ significantly (p = 0.22) for A549 cells.

