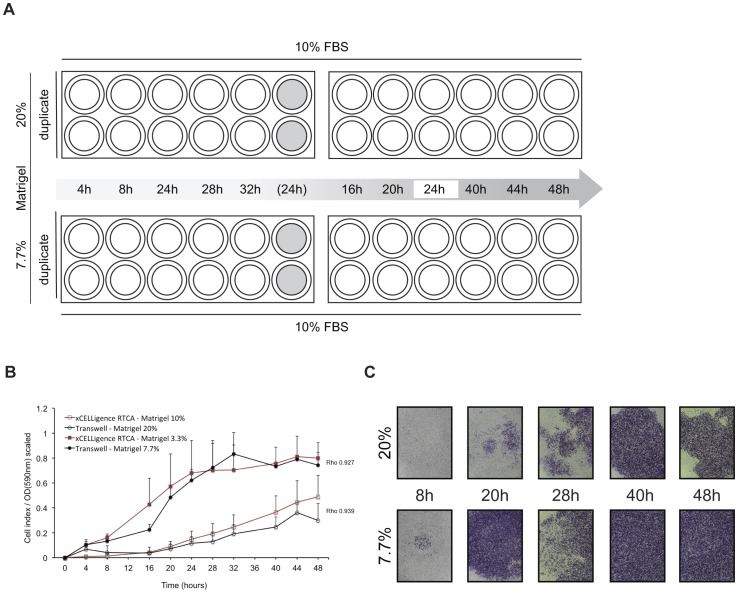
Figure 6. Time-dependent invasion profile of MDA-MB-231.
A. Experimental design to quantify MDA-MB-231 Matrigel invasion. Two times two 24-well Transwell plates were used to examine invasion to FBS through a 20% (v/v) (top row) and 7.7% (v/v) Matrigel layer (bottom row) after 24 hours of serum starvation. At ten time points during a 48-hour incubation period inserts were fixed and stained in duplicate. Two inserts containing cell-free media (grey fill) have been included throughout the experiment and fixed and stained after 24 hours incubation to assess background absorption in optical density (OD) measurements. In addition, to exclude influence of inter-plate variability on observed migration rates, each plate contained duplicate 24-hour control inserts. B. MDA-MB-231 dynamic cell invasion profiles, generated by Transwell experiments (black) and xCELLigence (red). Graphs represent normalized signals (scaled values 0–1) of invasion through 20% (open circles), 10% (open squares), 7.7% (filled circles) and 3.3% (filled squares) to medium+10% FBS with associated Spearman's rank correlation coefficients (Rho). All results are from three independent duplicate experiments with SD. C. Sequential pictures showing invasive MDA-MB-231 cells at the indicated time points during a 48-hour incubation on Transwells coated with 20% (top row) and 7.7% Matrigel (bottom row). Pictures (obj. 2.5×) show cells fixed and stained in 20% methanol/0.1% crystal violet.

