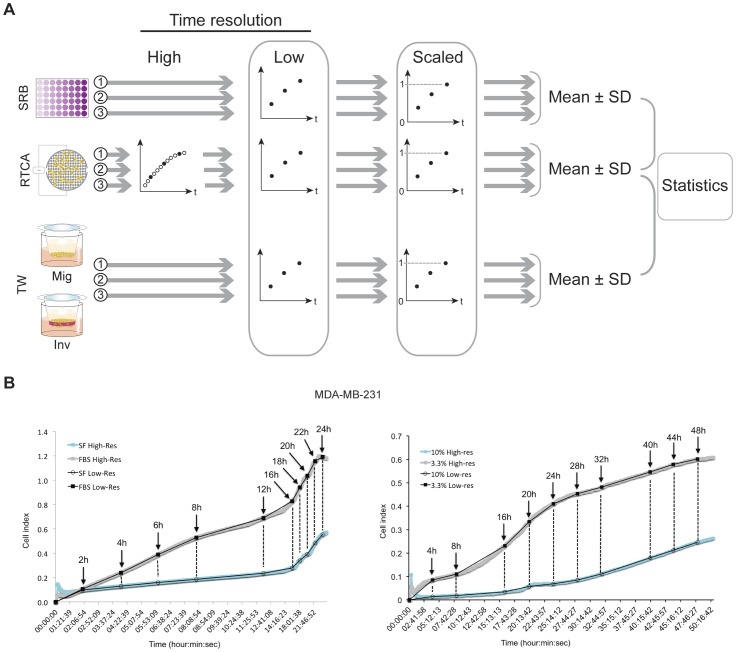
Figure 7. Prestatistical data processing.
A. Schematic depiction of processing kinetic data generated by SRB, xCELLigence and Transwells. Raw data with high time resolution (filled and empty circles), resulting from independent xCELLigence experiments (1, 2, 3 and grey arrows) are reduced to a lower time resolution by selecting only the data points corresponding with the time points of endpoint detection (filled circles only). Subsequently, data have been normalized by dividing all values by the highest value recorded over all experiments per method, resulting in a modified Y-axis scale that ranges from 0 to 1. Finally, the normalized data have been averaged with calculation of SD for the three independent experiments per method. B. Reduction of high-resolution data, generated by xCELLigence, to a low resolution comparable with data from conventional assays. The example shows migration (left) and invasion (right) of MDA-MB-231 cells through two densities of Matrigel. The ten time points in the Transwell method (black arrows) were selected from the xCELLigence plots (grey and blue) to reconstruct a low-resolution graph (black), directly comparable to the Transwell data. An identical approach was applied for all other processes studied.

