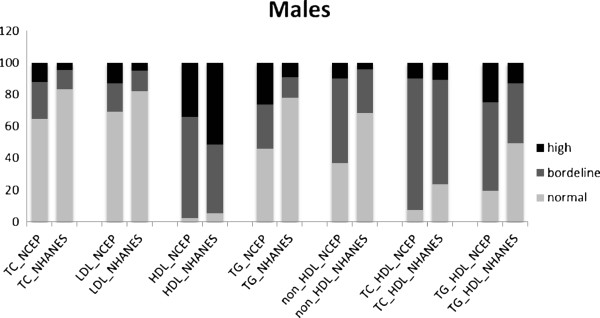
Figure 1.
Prevalence of normal, borderline and high lipoproteins levels in males aged 14-19 years with two sets of classifications. NCEP: The National Cholesterol Education program; NHANES: National Health and Nutrition Education Survey; TC: total cholesterol; LDL-C: low density lipoprotein cholesterol; HDL-C: high density lipoprotein cholesterol; TG: triglycerides. *For HDL levels, the black color represented Low level of HDL, the dark grey represented borderline level and grey color represented high level of HDL-C.

