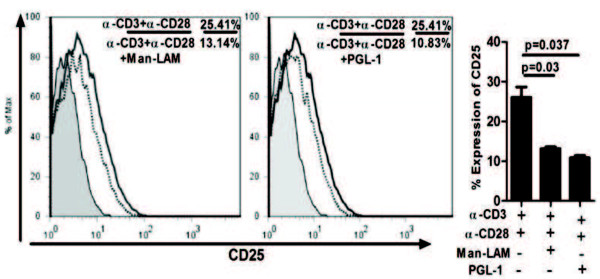
Figure 7.
Mycobacterial lipid antigens inhibit TCR/CD28 stimulated IL-2Rα (CD25 expression. Flowcytometric analysis showing histogram overlay of CD25 receptor of untreated or antigen pretreated Jurkat T-cells stimulated with α-CD3 + α-CD28 antibodies. Histograms are representative plots of experiments repeated at least 3 times independently. Here solid bold curve represent expression on α-CD3 + α-CD28 stimulation while dotted bold lines represent expression on stimulation with α-CD3 + α-CD28 plus antigens and shaded histogram shows expression by unstimulated cells. Bar diagrams represent mean ± SEM values of percent positive cells expressing CD25.

