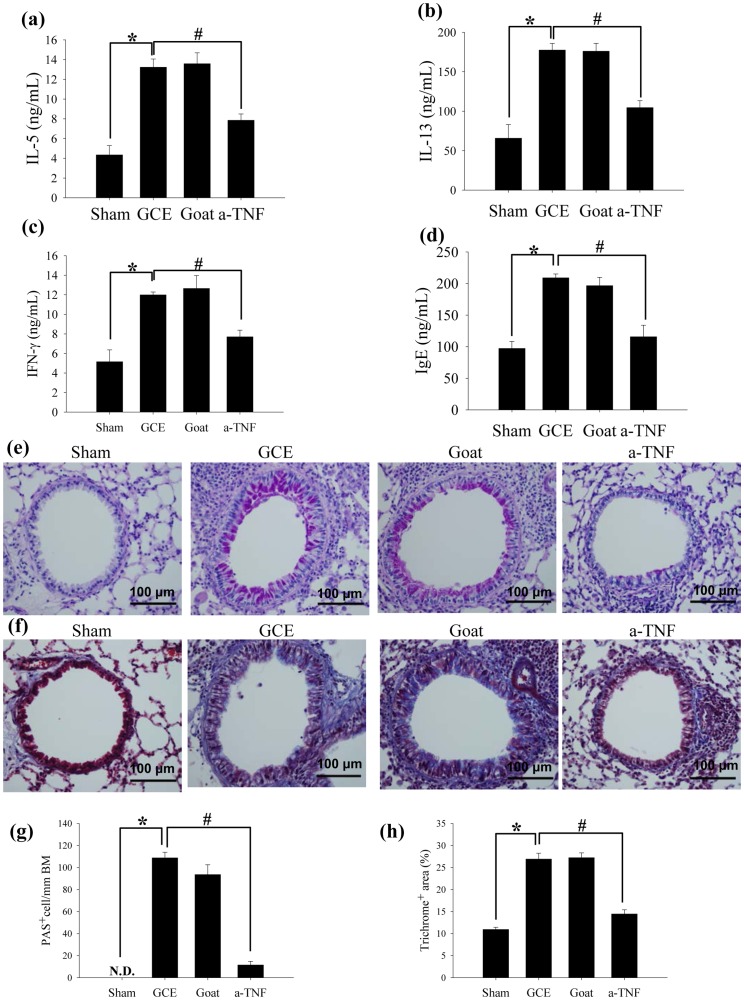
Figure 4. GCE promotes allergic phenotype through the TNF-α pathway.
Lung homogenates were harvested and used for measuring (a) IL-5, (b) IL-13 and (c) IFN-γ. (d) The level of serum IgE in the blood. Lung tissues were stained with (e) PAS and (f) Masson's Trichrome. (g) PAS-positive cells in peri-bronchial regions and (h) total collagen deposition in the lung tissue were quantitatively calculated. * indicates statistical significance between “Sham” and “GCE” (n = 5, p<0.05). # indicates statistical significance between “GCE” and “a-TNF” (n = 5, p<0.05). All data are representative of three independent experiments.

