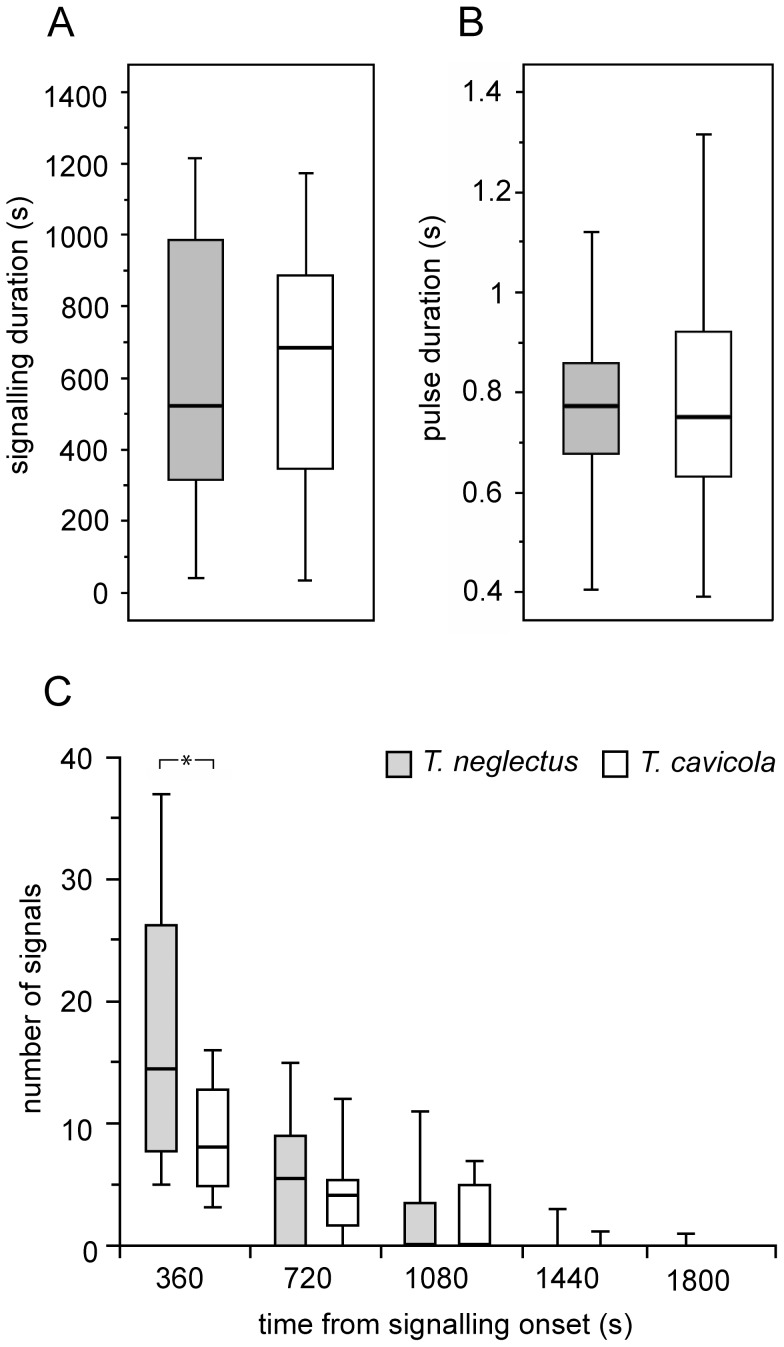
Figure 2. Temporal characteristics of post-copulation signalling of T. neglectus and T. cavicola.
A. Duration of the whole signalling process (T-test; t 27 = 0.79, P = 0.937). B. Pulse duration (T-test; t 135.176 = −0.748, P = 0.456). C. The number of pulses emitted in consecutive 360 s time intervals. In the last two intervals, the left position refers to T. neglectus. The asterisk indicates a significant difference in the signal number (T-test values: t 25.054 = 2.716, P<0.05). The legend refers to A−C. Data are shown as a box-plot with median and interquartile ranges (outliers excluded).

