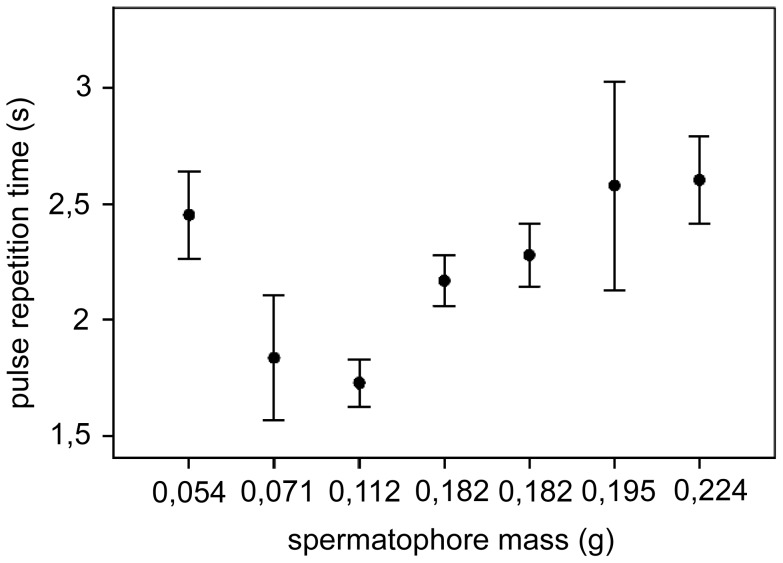
Figure 4. Correlation of the repetition time of courtship pulses with the spermatophore mass in T. neglectus.
Mean values are shown with the standard error. The signals were recorded for seven of the mated males (n1−n7 = 23−75), which were weighed to assess the SP mass. Regression test values; F 1. 229 = 47.181, P<0.001 for N = 6 (without the first data point)/F 1,288 = 2.951, P = 0.087 for N = 7.

