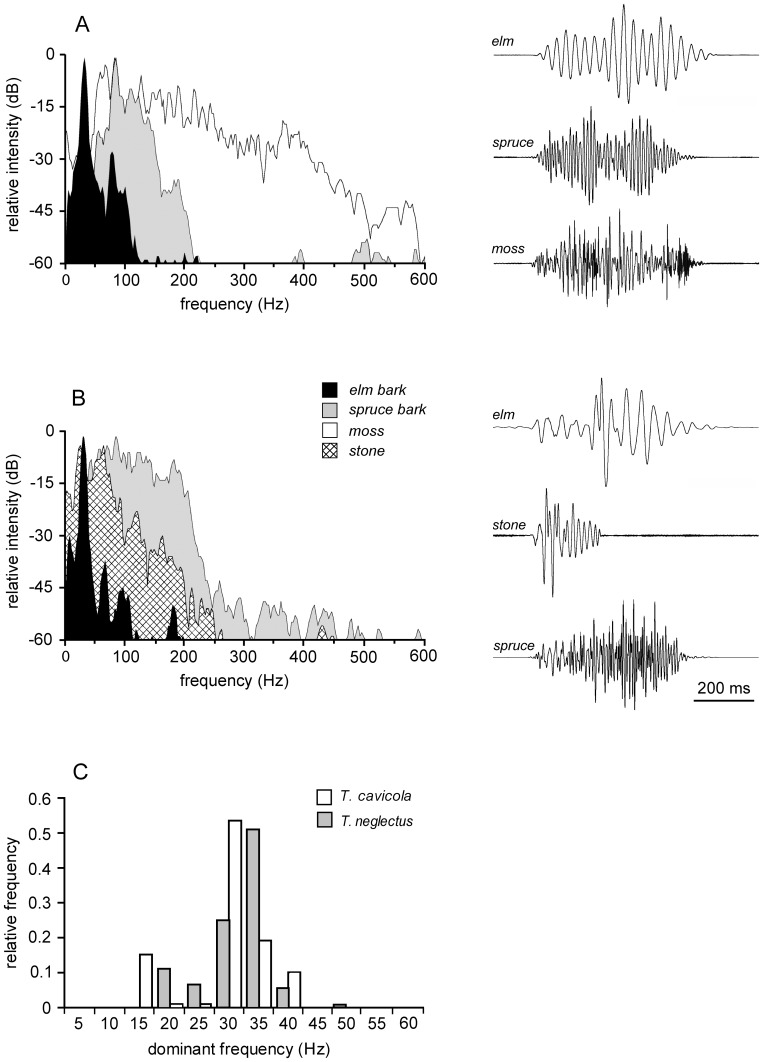
Figure 5. Spectral properties of vibratory signals.
Velocity spectra with oscillograms of sample courtship (A) and post-copulation signals (B) of T. neglectus recorded on different substrates (the legend and the time scale refers to A and B). C. Distribution of the dominant frequencies in post-copulation signals recorded on elm bark, compared between the two species (nTC = 99, nTN = 288).

