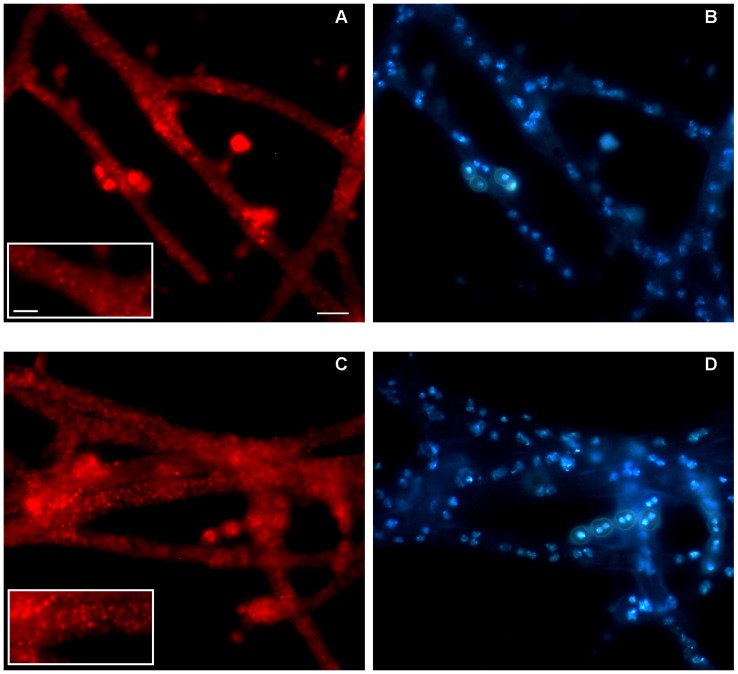
Figure 3. Fluorescence analysis of AFDsRED and AfP33 strains.
The fluorescence analysis was performed to compare the presence of peroxisomes (red) between (A, B) AfDsRED and (C, D) AfP33 strains. Cells not expressing p33 displayed a punctate pattern of fluorescence (A and detail in the boxed area) corresponding to scattered peroxisomes whereas cells expressing p33 showed the presence of red spots revealing an increased number of peroxisomes (C and detail in the boxed area). Nuclei are stained with DAPI. Scale bars = 10 mm (A–D); 5 mm (boxed areas in A and C).

