
Figure 1. Genome-wide gene-expression profiling on brain, liver and spleen of Npc1 −/− mice. (A).
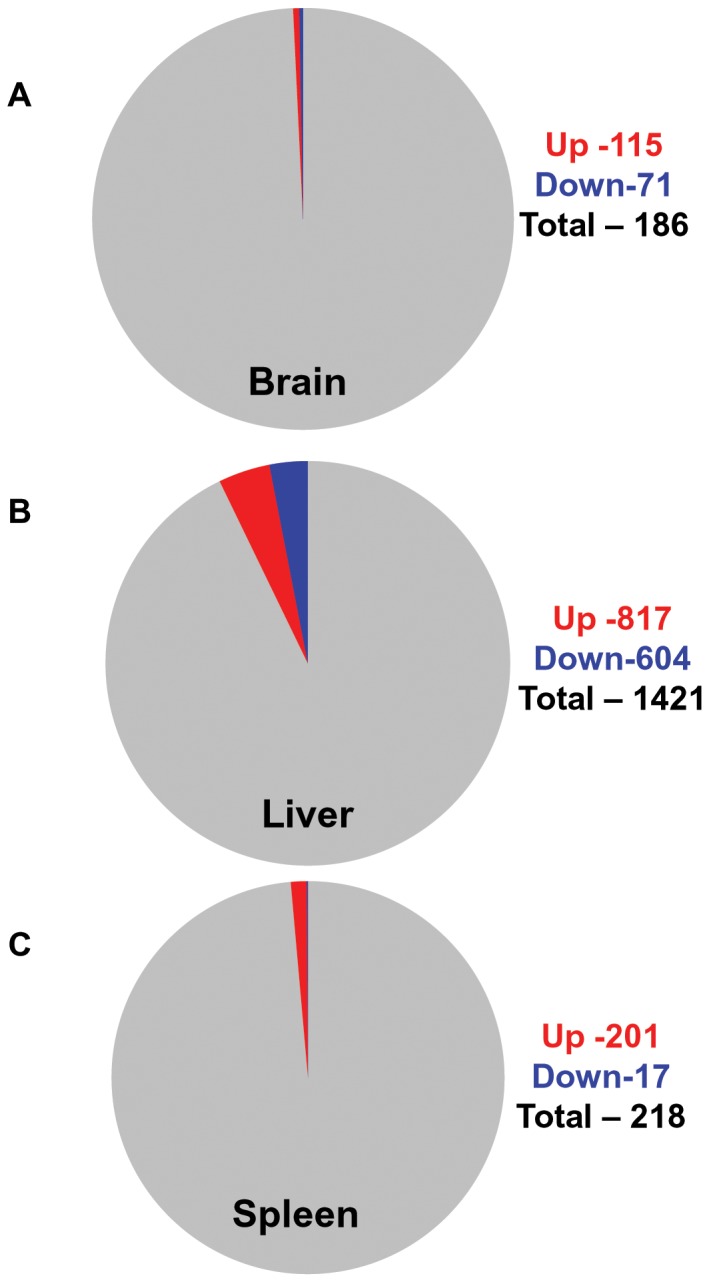
Brain. Pie chart displays 0.46% up regulated and 0.28% down regulated transcripts relative to the total number of transcripts (24615) expressed in the brain of Npc1−/− mice across the life span. Total RNA from brain of 27 mice (11 Npc1−/− and 16 age matched controls) age ranging from 20–84 days (6 age groups, see Figure S1A for details) were isolated and gene expression was analyzed using affymetrix microarray chips (see Materials and Methods). The expression level of 186 genes (115 up and 71 down) in the Npc1 −/− mice changed by 1.5 fold or higher (p<0.05). (B) Liver. Pie chart displays 4.44% up regulated and 3.28% down regulated transcripts relative to the total number of transcripts (18377) expressed in the liver of Npc1−/− mice across the life span. Total RNA from the liver of 12 mice (6 Npc1 −/− and 6 age matched Npc1 +/−) age ranging 20–71 days (3 age groups, see Figure S1B for details) were isolated and transcript expression was analyzed as described for the brain. The expression of 1421 genes (817 up and 604 down) in the liver of Npc1 −/− mice changed by 1.5 fold or higher (p<0.05). (C) Spleen. Pie chart displays 1.3% up regulated and 0.11% down regulated transcripts relative to the total number of transcripts (15348) expressed in the spleen of Npc1−/− mice across the life span. Experimental set up and analysis criteria were identical to that described for the liver. The expression of 218 genes (201 up and 17 down) in the spleen of Npc1 −/− mice changed by 1.5 fold or higher (p<0.05).