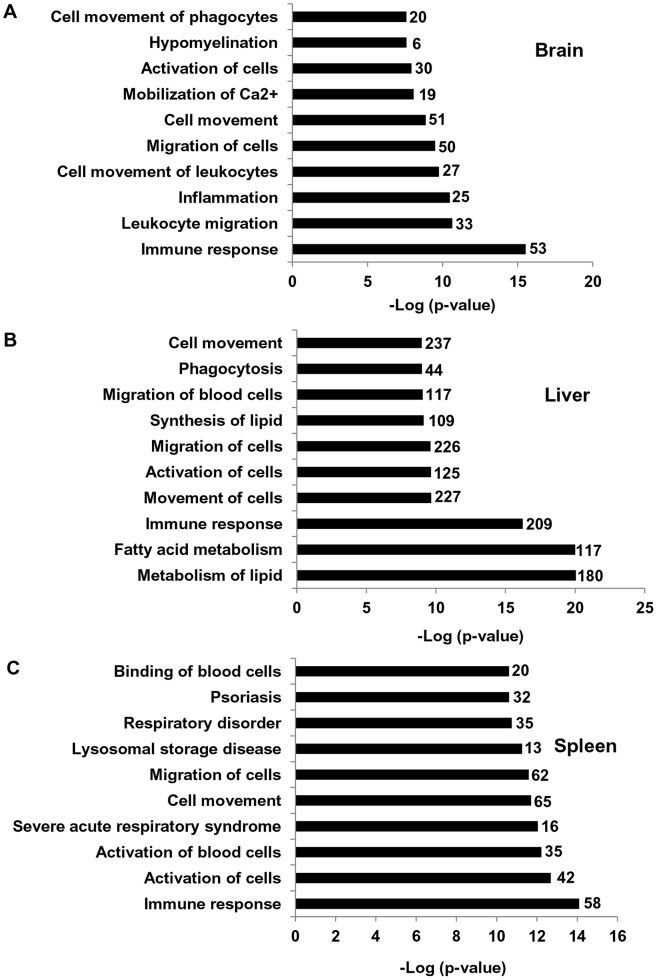
Figure 2. Enrichment of top 10 biofunctions pathways in brain, liver and spleen of Npc1 −/− mice. (A).
The top 10 biofunctions pathways derived from IPA analyses of differentially expressed genes in the brain of Npc1 −/− mice and ranked by ‘p values’ (lowest to highest) are shown. The numbers along each bar represent the total number of differentially expressed genes (both up and down regulated) categorized in each biofunction (see also Table S4). A total of 53 genes (45 up and 8 down regulated) associated with immune response were enriched in the brain of Npc1 −/− across all time points (B) Bar diagram shows the top 10 biofunctions enriched in the liver of Npc1 −/− compared to Npc1 +/−. A total of 209 genes (159 up and 50 down regulated) associated with the immune response were enriched in the liver of Npc1 −/− across all time points (see also Table S4). (C) Bar diagram shows the top 10 biofunctions enriched in the spleen of Npc1 −/− compared to Npc1 +/−. A total of 58 genes (49 up and 9 down regulated) associated with the immune response were enriched in the spleen of Npc1 −/− across all time points (see Table S4).

