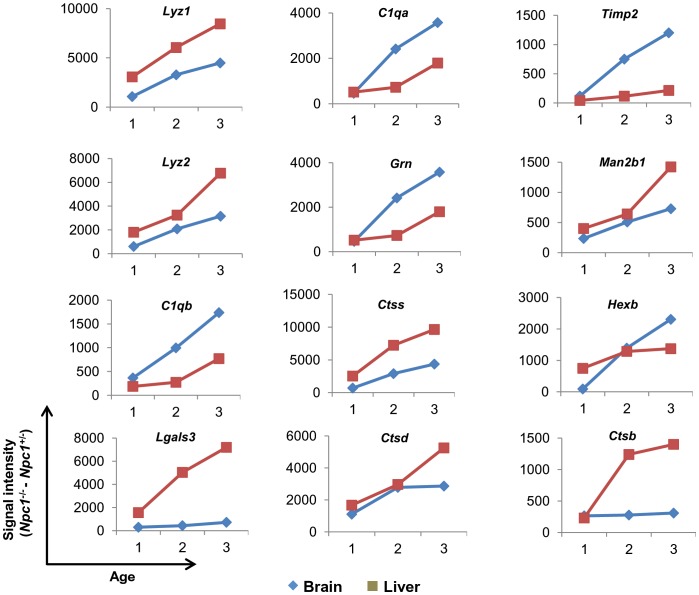
Figure 3. Age dependent over expression of 12 potential secretory genes in brain and liver of Npc1 −/− mice.
The raw signal intensity of all 12 genes obtained after Dchip analysis of brain and liver at three distinct time points (1 corresponds to 20–25 days, 2 corresponds to 54–55 days and 3 corresponds to 67–71 days for liver and 81–84 days for brain) were taken and the mean was calculated. Mean signal intensity obtained from 2 Npc1 +/− mice was subtracted from the mean values of 2 Npc1 −/− mice corresponding to same age group. The process was undertaken for each gene at all three time points for both brain and liver. The difference obtained for each time point is plotted.

