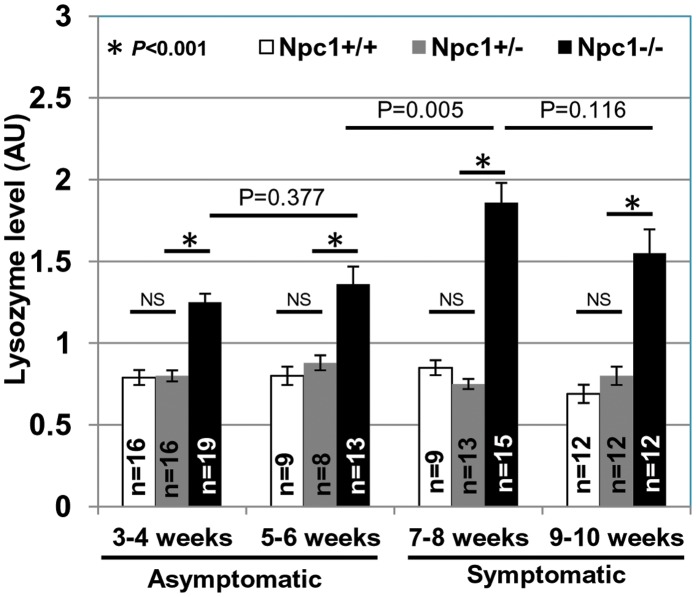
Figure 4. Elevated lysozyme activity in plasma of Npc1nih Npc1 −/− mice.
Lysozyme activity in the plasma of Npc1 +/+, Npc1 +/− and Npc1 −/− mice was assessed using a commercially available fluorescence based lysozyme assay kit (see Materials and Methods). ‘n’ denotes the number of mice used per group. x-axis denotes the age of mice (in weeks) when the plasma lysozyme activity assay was performed. Error bars show the mean±SEM. ‘NS’ indicates not significant. Student’s t test was carried out to determine the statistical significance.

