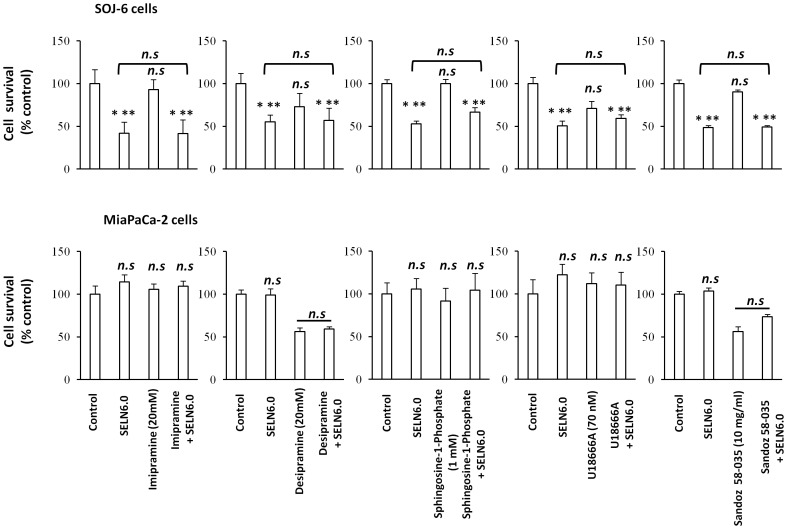
Figure 6. Proliferation of MiaPaCa-2 and SOJ-6 cells in the presence of drugs.
MiaPaCa-2 and SOJ-6 cells were incubated 1h with drugs affecting lipid metabolism at the indicated concentration then SELN6.0 (16 nmoles cholesterol/ml) were added for 24h in the presence or absence (control) of drugs at indicated concentration. At the end of incubation, proliferation was measured by MTT assay and expressed as % of control. Results are means (± SD) of independent experiments, (n = 24, Student’s t-test).

