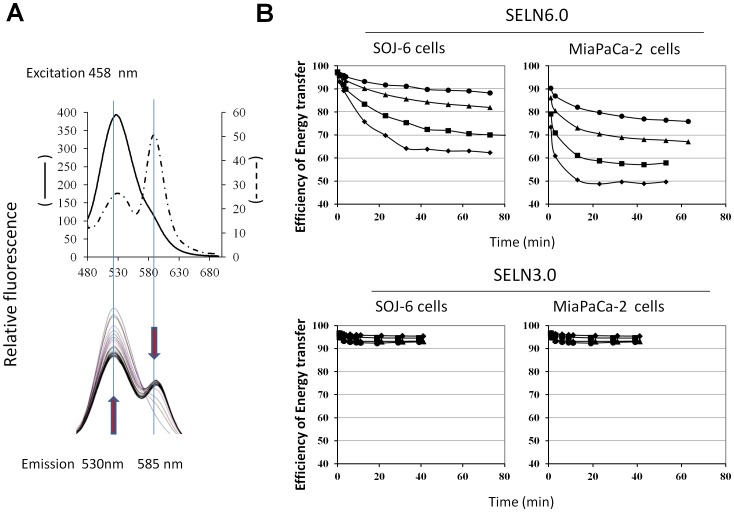
Figure 8. SELN interactions with SOJ-6 and with MiaPaCa-2 cells.
(A) Left spectrum depicts a typical FRET obtained with SELN6.0 labeled with N-NBD-PE and N-Rh-PE. Once excited at 458 nm, N-NBD-PE transfers energy to N-Rh-PE generating light emission at 585 nm (dashed line curve, upper panel). When SELN6.0 preparation was diluted in a micellar solution of detergent (Tween 20, 1% final) the FRET depicted by the 585 nm emission peak disappears to favor N-NBD-PE maximal emission (f0) at 530 nm (single line curve, in upper panel). The lower panel shows typical variation of fluorescence emission (following excitation at 435 nm) of SELN6.0 (50 µl) in the presence of 1.0×10⁶ SOJ-6 cells. Arrows indicate variations in fluorescence emission with time (0 min up to 60 min, 3 min steps). (B) Variation with time of the energy transfer efficacy E = 1-(f/f0) when cells were mixed with SELN. f0 is determined at the end of each experiment (see A). Typical data obtained with : • 0.25×10⁶, ▴ 0.5×10⁶, ▪ 1.0×10⁶, and ♦ 2.0×10⁶ cells.

