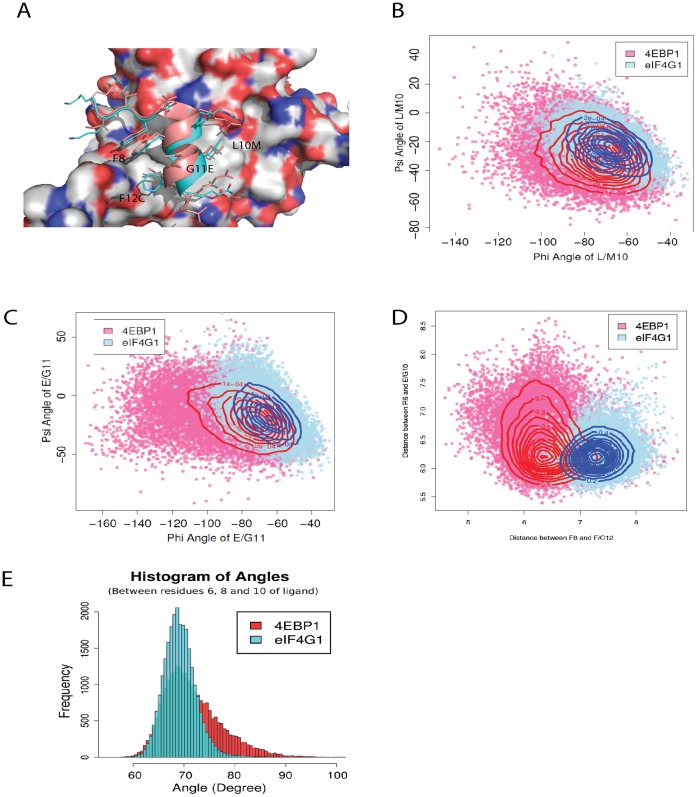
Figure 6. Comparison of 4EBP1 and eIF4G1 peptides suggests that eIF4E interacting peptides can form an ensemble of conformations when in complex with eIF4E.
A) An overlay of two eIF4E crystal structures complexed with either a 4EBP1 (1EJ4) or eIF4G1 (2W97) derived peptide demonstrating the deviation in their C-terminal structural conformations. 4EBP1 is shown in salmon and eIF4G1 in cyan. B) A plot of the φ and ψ angle distribution, derived from the 50 ns simulations of the peptides eIF4G1 and 4EBP bound to eIF4E, for the residues L10 and M10 respectively. C) A plot of the φ and ψ angle distributions, derived from the 50 ns simulations of peptides eIF4G1 and 4EBP bound to eIF4E, for the residues G11 and E11 respectively. D) A plot showing the distribution of distances, for the peptides eIF4G1 and 4E-BP1 when bound to eIF4E, between the Cα atoms of residues 6 and 10 versus the distance between the Cα atoms of residues 8 and 12. The distances were calculated from their respective 50 ns simulations for both peptides. E) A histogram of the angular distribution between the Cα atoms of positions 6, 8 and 10 of the eIF4G1 and 4EBP1 peptides from the 50ns simulations respectively.

