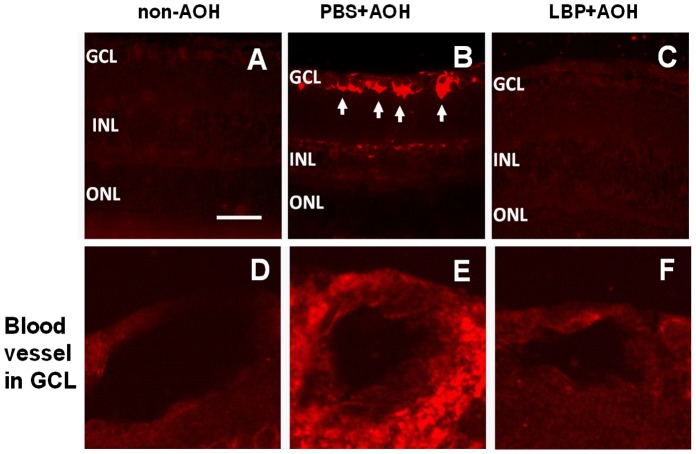
Figure 9. Up-regulation of the expression of Aβ1–42 in PBS-fed retina and down-regulation in LBP-fed retina at day 4 after AOH.
Representative photos of Aβ1–42 immunostaining on retinal sections in non-AOH control group (A), PBS-fed-AOH group (B) and LBP-fed-AOH group (C). Note that the Aβ1–42 staining is present in neurons of GCL (arrows) in (B). (D–F) The enlarged blood vessel in GCL from the non-AOH, PBS+AOH and LBP+AOH group, respectively. Scale bars: 50 µm. Aβ1–42, amyloid-beta 1–42; PBS, phosphate-buffered saline vehicle; AOH, acute ocular hypertension; LBP, Lycium Barbarum Polysaccharides solution; GCL, ganglion cell layer; INL, inner nuclear layer; ONL, outer nuclear layer.

