
Figure 3.
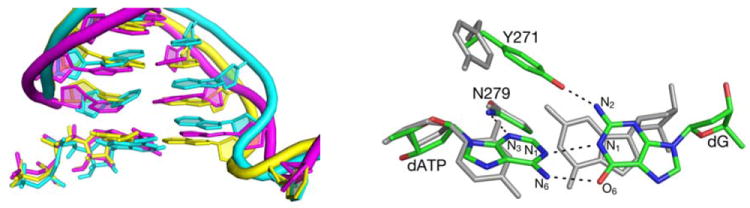
Left: Overlap of the DNA and dNTP structures from a representative snapshot of MD simulation of pol β containing dG•dATP pair (magenta) with the crystal structures of the DNA in ternary pol β complexes containing the dG•dCTP (yellow) and dG•dATP base pairs (cyan). Right: Overlap of the average calculated structures of the dG•dCTP (grey) and dG•dATP (atom-type colors) base pairs in the GSA pol β - DNA-dNTP complex. Hydrogen bonding interactions in the dG•dATP mispair are shown with dashed lines.