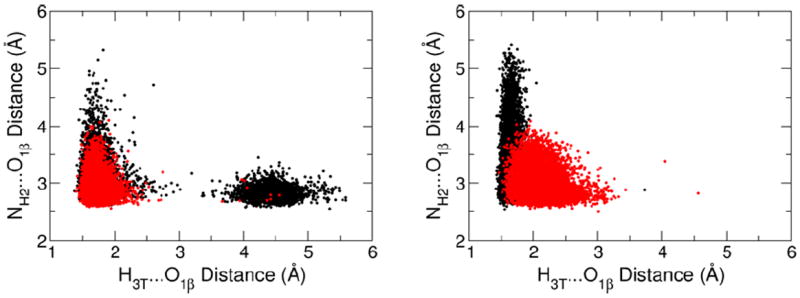
Figure 6.

The distribution of the distances characterizing the internal dNTP hydrogen bond between the O3’H group of deoxyribose and a non-bridging oxygen of the β-phosphate, and the hydrogen bond between the same β-phosphate oxygen and Arg183. Each dot corresponds to a single snapshot along a 10 ns MD trajectory for the GSA (red) and PTS model (black) complexes of pol β. The distance distributions from the simulations with the correct and incorrect dNTP substrates are shown in the left and right plots, respectively.
