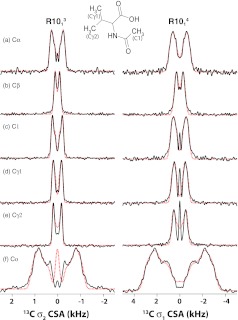
Figure 5.
13C σ1- (right) and σ2- (left) CSA line shapes for Cα (a), Cβ (b), C1 (c), Cγ1 (d), Cγ2 (e), and Co (f) of [15N]-N-acetyl-valine generated by symmetry sequences R1014 and R1013, respectively. Experimental data are shown as black solid lines, and simulated data – as red dotted lines. The sample was spun at the MAS frequency of 10 kHz. The best-fit 13C CSA parameters for all carbon sites are listed in Table 3.

