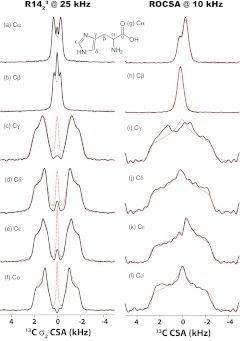
Figure 6.
Experimental (black solid lines) and simulated (red dotted lines) 13C σ2-CSA line shapes recorded by R1423 sequence (left) and 13C CSA line shapes recorded by ROCSA sequence (right). Each line shape represents an individual 13C site U-[13C, 15N]-histidine: Cα ((a), (g)), Cβ ((b), (h)), Cγ ((c), (i)), Cδ ((d), (j)), Cɛ ((e), (k)) and Co ((f), (l)). The sample was spun at the MAS frequencies of 25 and 10 kHz for RNCSA and ROCSA experiments, respectively. The best-fit 13C CSA parameters for all carbon sites are summarized in Table 4.

