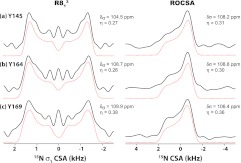
Figure 7.
Left: Experimental (black solid lines) and simulated (red dotted lines) 15N σ1-CSA line shapes of U-[13C, 15N]-Tyr HIV-1 C-terminal domain (CTD) of CA protein recorded by R813 sequence. Right: Experimental (black solid lines) and simulated (red dotted lines) 15N CSA line shapes of the same sample recorded by ROCSA sequence. The sample was spun at the MAS frequency of 10 kHz. The best-fit CSA parameters are shown for each Tyr residue.

