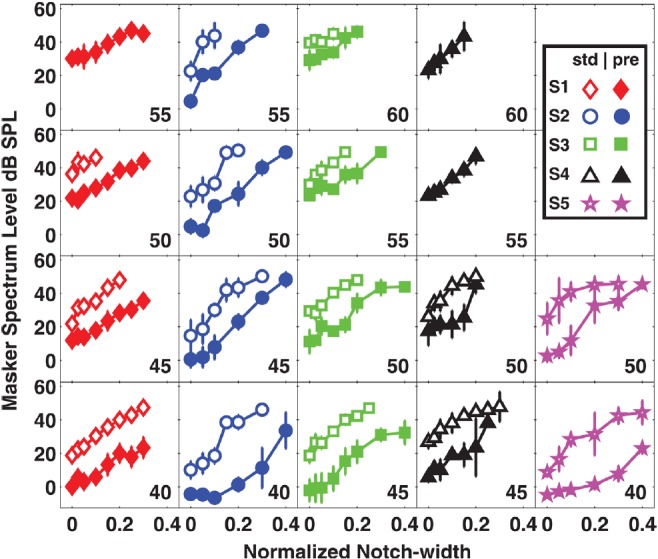
Figure 1.

(Color online) NNTCs for standard (open symbols) and precursor (closed symbols) conditions as a function of signal level in five subjects. Signal level in dB SPL is displayed in each panel. Each column of panels represents a different subject as shown by the legend. The data plotted are from normalized notch-widths (x-axis) that were symmetric around the center frequency (4000 Hz). For visual clarity, asymmetric notch-widths are not plotted, however, they were included in fitting the data and are provided in Table TABLE III. in the Appendix. Error bars represent one standard deviation about the mean.
