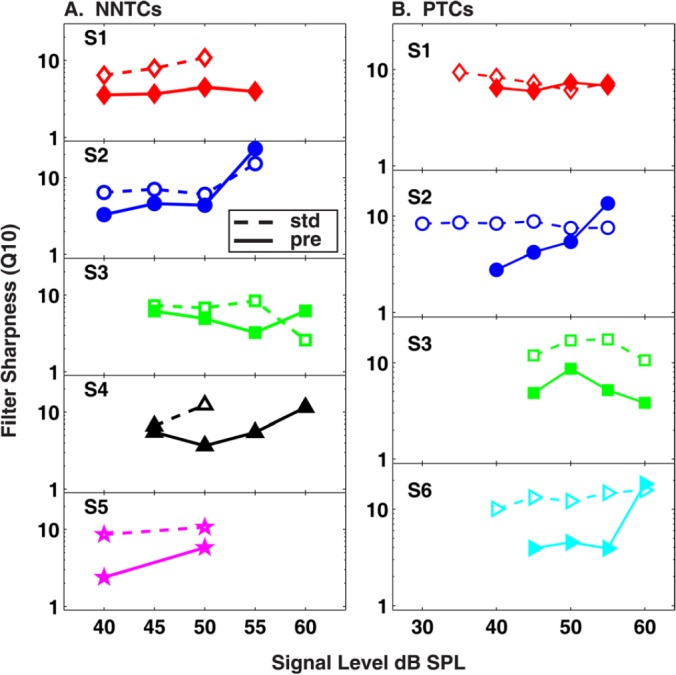
Figure 2.

(Color online) Estimates of filter sharpness () for (a) NNTCs and (b) PTCs. The standard (“std”) and precursor (“pre’’) conditions are displayed as open and closed symbols, respectively. Each panel represents a different subject and shows estimates as a function of signal level in dB SPL.
