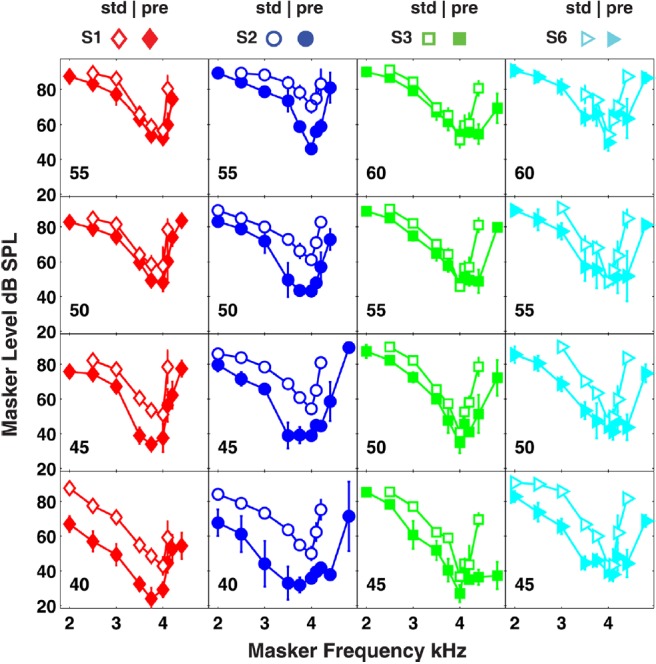
Figure 3.

(Color online) PTCs in the standard (open symbols) and precursor (closed symbols) conditions as a function of signal level in four subjects. Each column of panels represents a different subject. Signal level in dB SPL is plotted in each panel. Error bars represent one standard deviation about the mean.
