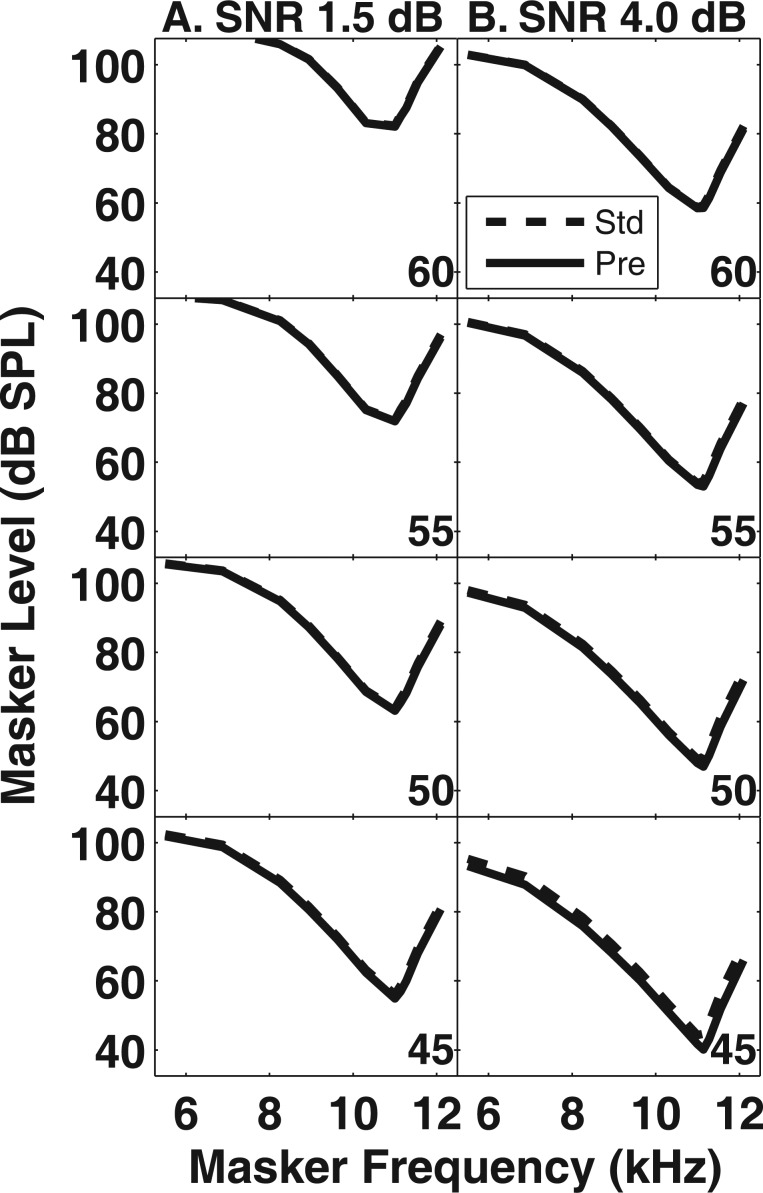
Figure 6.
Simulated PTCs based on the assumptions of the additivity-of-masking hypothesis (see text). Each panel displays simulated PTCs in the standard (dashed lines) and precursor (solid lines) conditions. The signal level associated with each pair of PTCs is indicated in the lower right corner of each panel. (a) Simulated PTCs with a SNR set to 1.5 dB. (b) Simulated PTCs with an SNR set to 4 dB.

