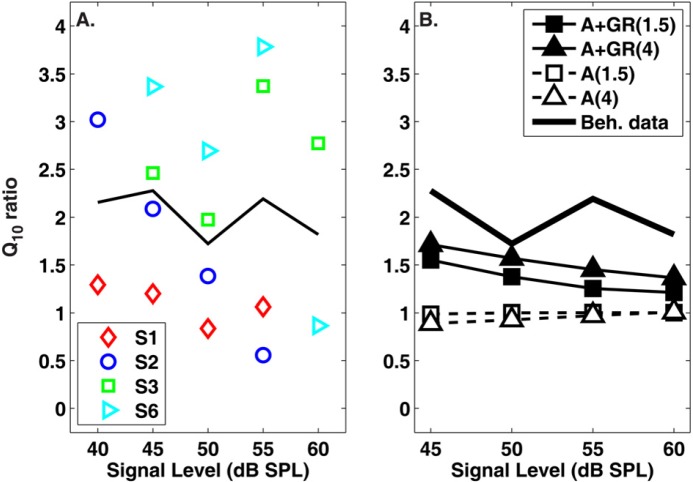
Figure 8.
(Color online) The ratio of values between experimental conditions (standard /precursor ) for psychophysical tuning curves measured empirically (a) or simulated with the model (b). The solid line in (a) and (b) is the mean of the behavioral data presented in (a). Symbols in (b) represent simulations based on the additivity (A) or additivity + gain reduction hypothesis (A + GR). The SNR (in dB) for a given simulation is also provided in the legend in parentheses.

