Figure 5.

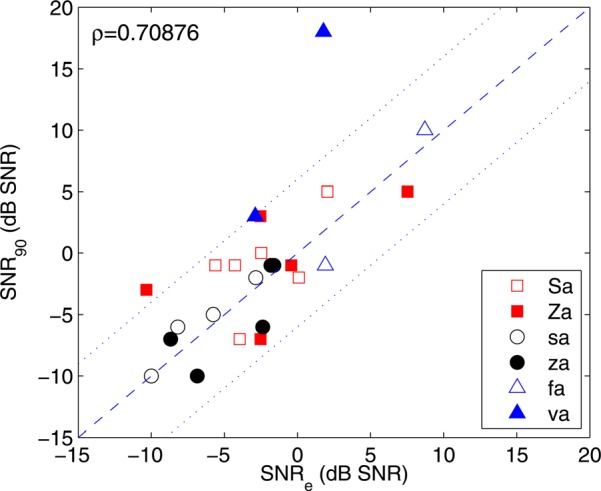
(Color online) Pearson correlation between SNRe and SNR90ρ = 0.71 (p-value = 1 × 10˗4). All utterances with 3DDS-isolated cue regions are reported. S, Z, and a are used to represent the IPA symbols /∫,ʒ,ɑ/, respectively.

(Color online) Pearson correlation between SNRe and SNR90ρ = 0.71 (p-value = 1 × 10˗4). All utterances with 3DDS-isolated cue regions are reported. S, Z, and a are used to represent the IPA symbols /∫,ʒ,ɑ/, respectively.