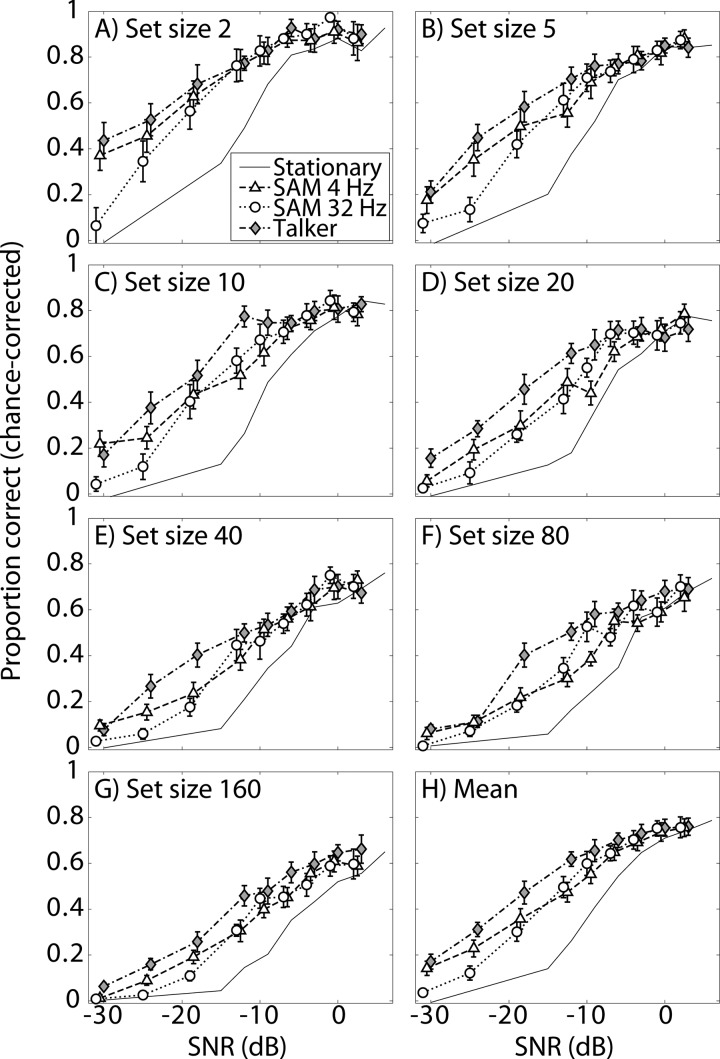
Figure 3.
Results of experiment 1, showing (a)–(g) group-mean CV/VC identification performance as a function of SNR for the four tested maskers with the seven set-size conditions plotted in separate panels and (h) mean performance across set-size conditions. Error bars indicate standard errors of mean values across listeners.

