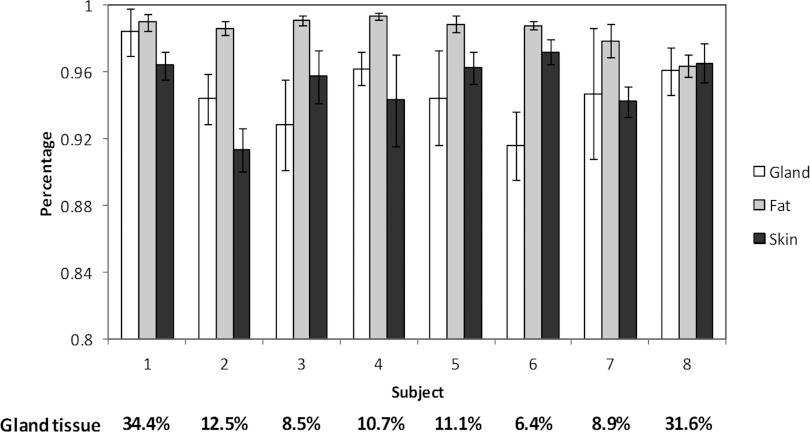
Figure 9.
Quantitative evaluation of the breast tissue classification for eight human patients. The Y axis is the overlap ratio between manual and automatic classification for the skin, glandular, and fatty tissue in the breast. The bars show the mean and standard deviations of the results from ten slices for each patient. The percentage of the glandular tissue is listed at the bottom for each patient.

