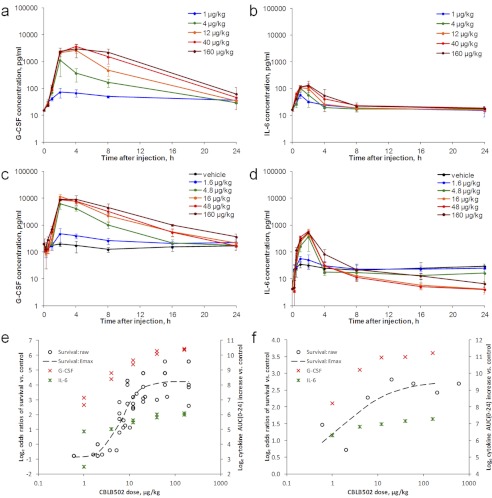
Fig. 2.
G-CSF and IL-6 responses in nonirradiated mice. a and b, time-dependent changes in G-CSF (a) and IL-6 (b) plasma levels in nonirradiated female ICR mice injected intramuscularly with either vehicle or the indicated doses of CBLB502. Each data point represents the mean ± S.D. cytokine concentration measured in plasma of six mice. c and d, time-dependent changes in G-CSF (c) and IL-6 (d) plasma levels in nonirradiated female C57BL/6J mice injected subcutaneously with either vehicle or the indicated doses of CBLB502. Each data point represents the mean ± S.D. cytokine concentration measured in plasma of six mice. e and f, congruence of the CBLB502 dose response of survival and cytokine induction in ICR (e) and C57BL/6J (f) mice. For ICR mouse studies, the cumulative data from several similar experiments are presented. Cytokine data points represent natural logarithm of mean AUC(0–24) increases per dose group. Dashed line represents four-parameter sigmoid (Emax) curve fit for the survival data (represented as natural logarithm of survival odds ratio of treatment versus control group).

