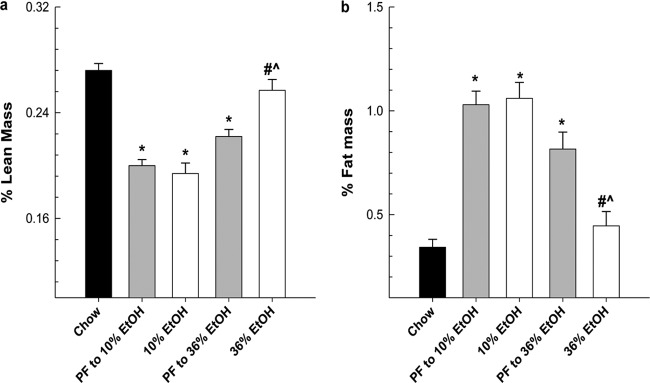
Fig. 1.
Female mice were chronically fed EtOH diets for 78 days. Peak EtOH concentrations for 10% EtOH (7 g/kg/day) and 36% EtOH (30 g/kg/day) were reached on day 25 and maintained for the length of the study. Body composition, lean mass (a), and fat mass (b) were assessed for each group by using in vivo CT scanning encompassing the entire visceral region of the animal as described under Materials and Methods and are expressed as a percentage of total body weight. Statistical significance was determined by one-way ANOVA followed by Student-Newman Keuls post hoc analysis. *, P < 0.05, all groups versus chow-fed animals. #, P < 0.001, 36% EtOH versus corresponding PF control. ^, P ≤ 0.001, 36% EtOH versus 10% EtOH.

