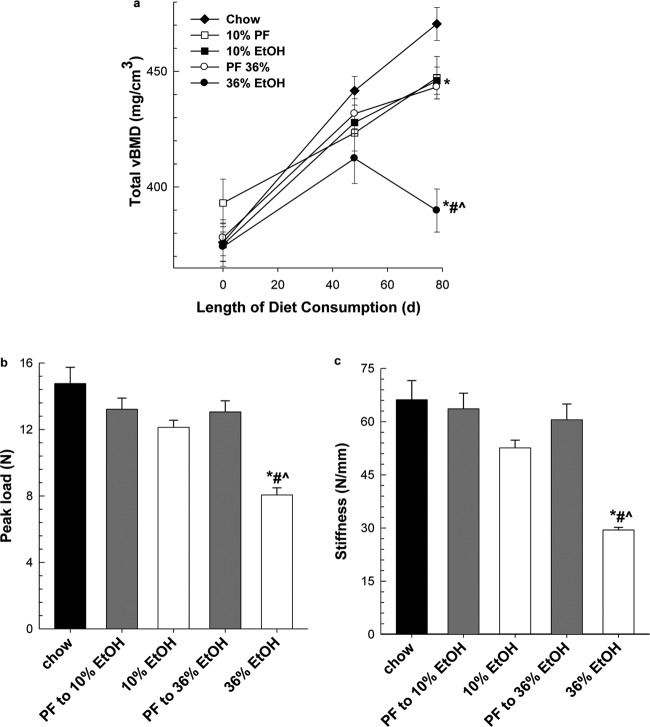
Fig. 2.
CT scanning was used to assesses total BMD (a) for chow-fed, EtOH-treated, and PF control groups in vivo as described under Materials and Methods on study days 0, 48, and 78. At sacrifice, mechanical strength of whole femurs, peak load (b) and stiffness (c), was assessed by three-point bending. Statistical significance was determined by one-way ANOVA followed by Student-Newman Keuls post hoc analysis. *, P < 0.05, all groups versus chow-fed animals. #, P < 0.001, 36% EtOH versus corresponding PF control. ^, P ≤ 0.001, 36% EtOH versus 10% EtOH.

