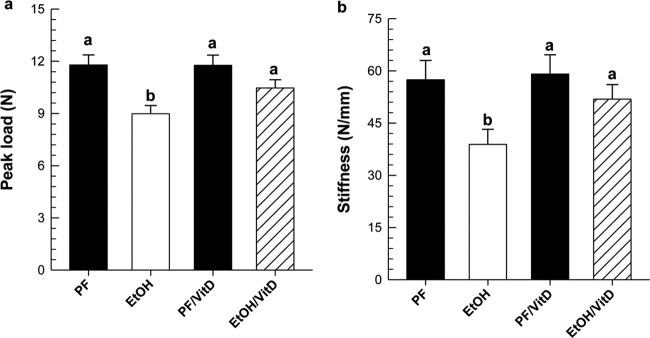
Fig. 5.
Mechanical strength testing of whole femurs from EtOH- and EtOH/VitD-treated mice (n = 7/group) and corresponding PF and PF/VitD controls (n = 4/group). a, peak load. b, stiffness. Statistical significance was determined by two-way ANOVA followed by Student Newman-Keuls post hoc analysis. Values with different letters are significantly different from each other (P < 0.05).

