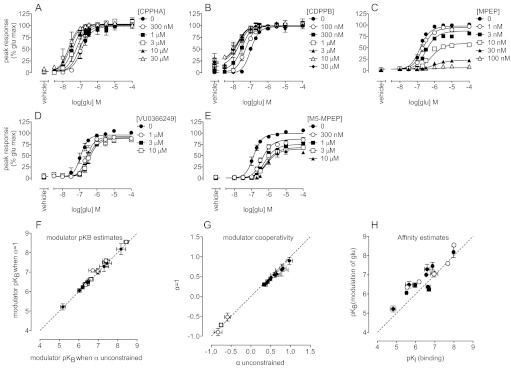
Fig. 4.
Allosteric modulation of glutamate concentration-response curves for Ca2+ mobilization in the low-level mGlu5-expressing HEK293A cell line. A and B, in the low-level, wild-type mGlu5-expressing HEK293A cell line, CPPHA (A) and CDPPB (B) induced leftward shifts in the glutamate concentration-response curve for intracellular Ca2+ mobilization, with no change in the maximal response. C to E, MPEP (C), VU0366249 (D), and M-5MPEP (E) inhibited glutamate-stimulated intracellular Ca2+ mobilization. F, modulator affinity estimates that were calculated by determining the composite cooperativity parameter αβ for PAMs (●) and allowing α to float for NAMs (○) (x-axis) or assuming α = 1 and calculating logβ (y-axis) were compared. G, for calculated cooperativity estimates, the assumption of α = 1 had no effect on the apparent cooperativity between glutamate and PAMs (●) and weak NAMs (○). H, affinity estimates for PAMs (●) and NAMs (○) determined from radioligand binding assays (x-axis) and Ca2+ mobilization assays (y-axis) in low-level mGlu5-expressing HEK293A cells were compared. Dashed line, unity. Data represent the mean ± S.E.M. from at least three independent determinations. Error bars not shown lie within the dimensions of the symbols.

