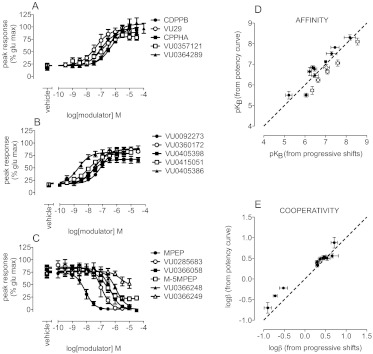
Fig. 9.
Estimation of allosteric modulator cooperativity and affinity values from potency curves. A and B, allosteric modulator potency curves were determined for the indicated positive allosteric modulators in the presence of an EC20 concentration of glutamate. CPPHA and VU0364289 both achieved maximal responses to glutamate; therefore, logβ values were constrained to equal the average maximal leftward shift in the glutamate concentration-response curves (Table 6) for estimations of pKB. For all other PAMs, both logβ and pKB values were determined through nonlinear regression analyses. C, negative allosteric modulators were assessed for their ability to inhibit a submaximal glutamate response. D, affinity estimates from potency curves (y-axis) and from progressive fold-shift analyses (x-axis) for PAMs (●) and NAM (○) showed strong correlation. E, strong correlation was observed between logβ values estimated through nonlinear regression from modulator potency curves (y-axis) and from progressive fold-shift analyses (x-axis). Data represent the mean ± S.E.M. from at least three independent determinations. Error bars not shown lie within the dimensions of the symbols. Dashed line, unity.

