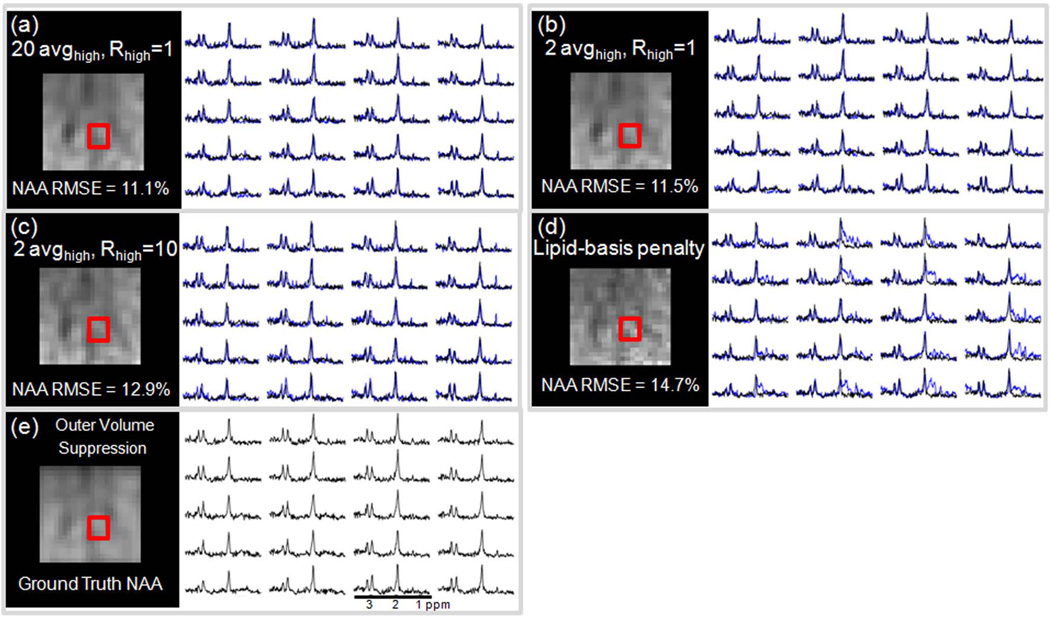
Fig. 4.
Comparison between normalized root-mean-square error (NRMSE) values of NAA maps computed within the 9×9 cm2 excitation box relative to the NAA maps obtained with the OVS method. In (a), reconstruction results obtained using the gold-standard (20 avghigh, Rhigh = 1) method (blue) and the OVS spectra (black) belonging to the region inside the red box are also overplotted. In (b), the basic proposed method (blue) and the OVS spectra are compared. The spectra obtained with the refined method (blue) and the OVS results (black) are overplotted in (c). Lipid-basis penalty and OVS spectra are compared in (d).

