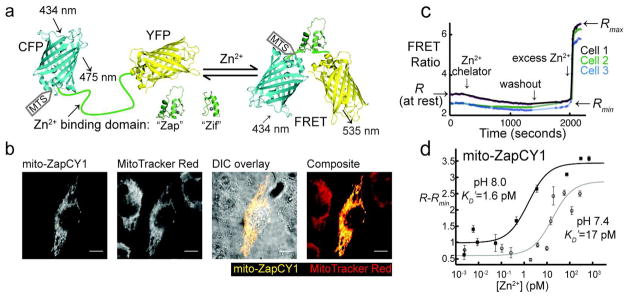
Figure 1.
Design of genetically encoded mitochondrial Zn2+ sensors mito-ZapCY1 and mito-ZifCY1. a) These sensors undergo a conformational change upon binding Zn2+, which leads to a change in FRET. The Zn2+-binding domain used in the “Zap” and “Zif” sensors consists of the first two Zn2+ fingers of the Saccharomyces cerevisiae protein Zap1, and the Zn2+ finger from the mammalian protein Zif268, respectively. The mitochondria targeting sequence (MTS) is appended to the N-terminus of the sensor. b) mito-ZapCY1 colocalizes with MitoTracker Red in living HeLa cells; Pearson’s coefficient 0.938; scale bars represent 10 μm. c) The fractional saturation of the sensor mito-ZapCY1 was determined in HeLa cells by measuring R (at rest), Rmin, and Rmax. d) The in situ KD′ of mito-ZapCY1 was determined in HeLa cells at pH 7.4 and 8.0. Each point represents the average (R−Rmin) of at least 3 cells in a single experiment at a specific free [Zn2+].

