
Figure 3.
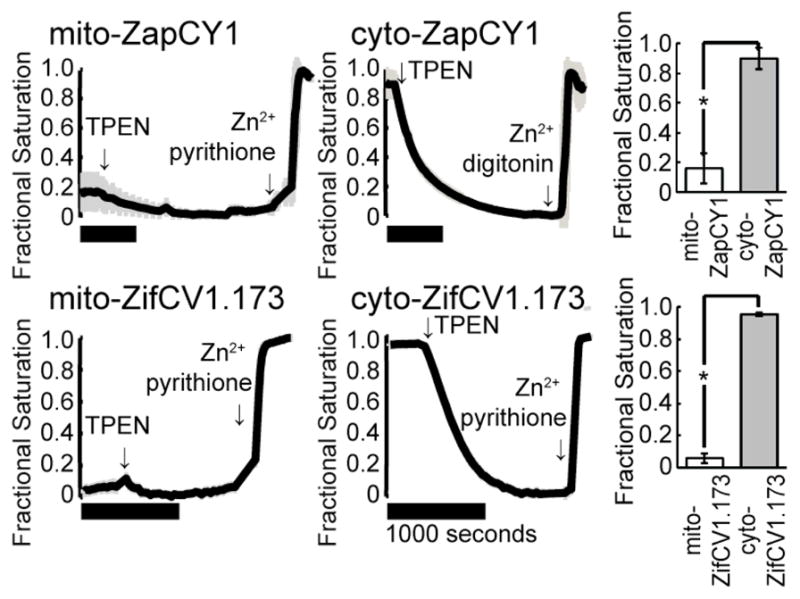
The fractional saturation of Zn2+ sensors is lower in the mitochondria than in the cytosol. Representative calibrations of ZapCY1 and ZifCV1.173 expressed in the mitochondrial matrix or the cytosol of HeLa cells are shown. Comparison of the fractional saturation of each sensor illustrates the difference in mitochondrial and cytosolic Zn2+ (* p < 0.0001, Student’s T-test). Horizontal black bars represent 1000 seconds. At least 3 cells were measured in each experiment.