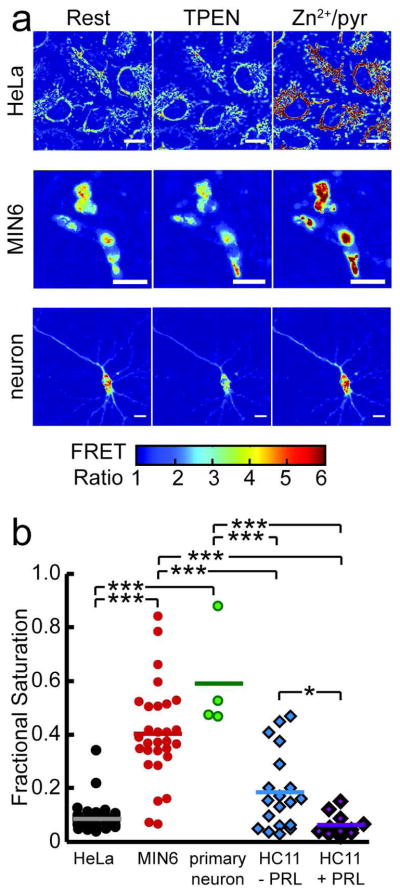
Figure 4.
Quantitative comparison of [Zn2+]mito in different cell types. a) Pseudocolor images of the FRET ratio of mito-ZapCY1 in HeLa cells, MIN6 cells, and a primary cortical neuron illustrate changes in the FRET ratio in response to treatment with 150 μM TPEN or with 0.75 μM pyrithione and 10 μM ZnCl2. Scale bars represent 10 μm. b) [Zn2+]mito differs significantly among cell types. Each marker shows the fractional saturation of mito-ZapCY1 in a single cell (*p<0.0022, Student’s T-test; ***p<0.0001, ANOVA, Tukey’s HSD post-hoc test).

