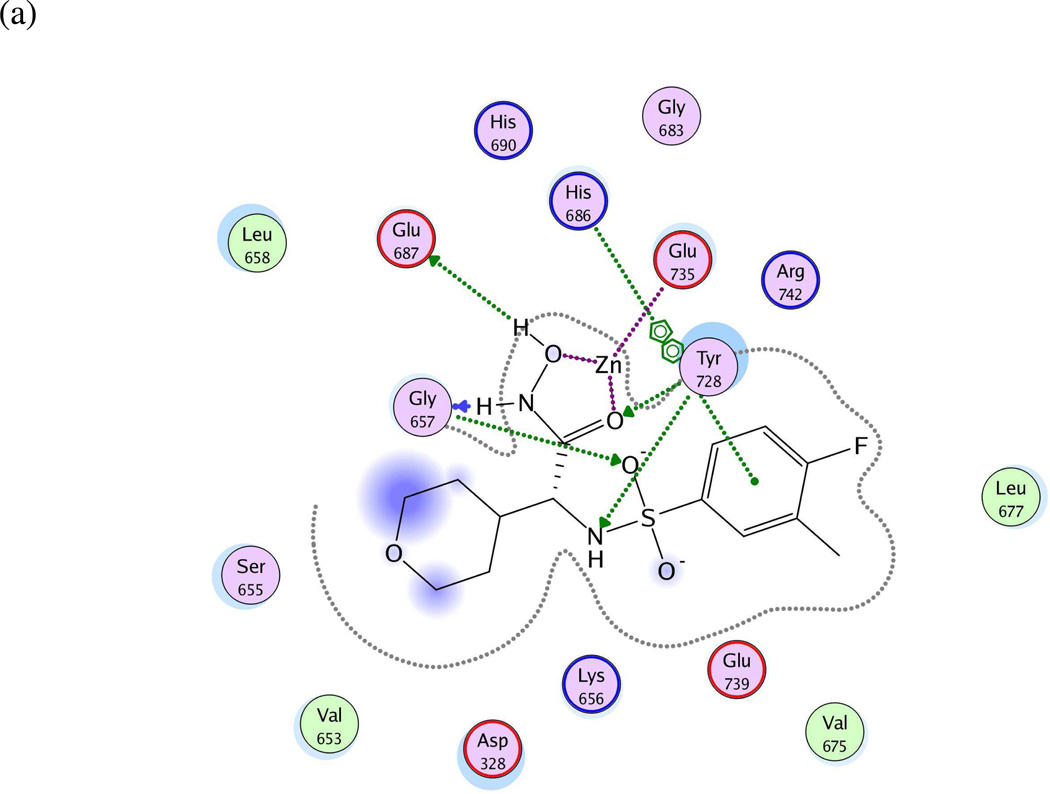
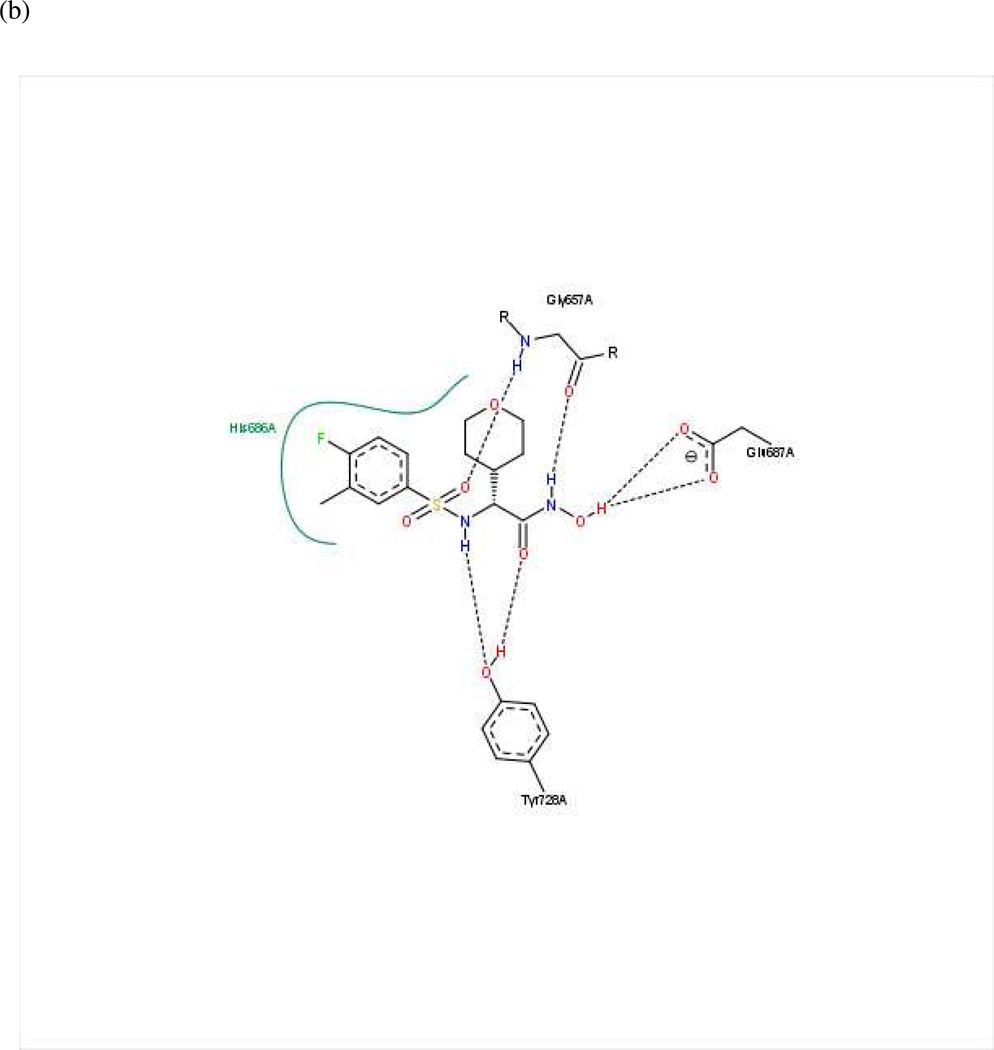
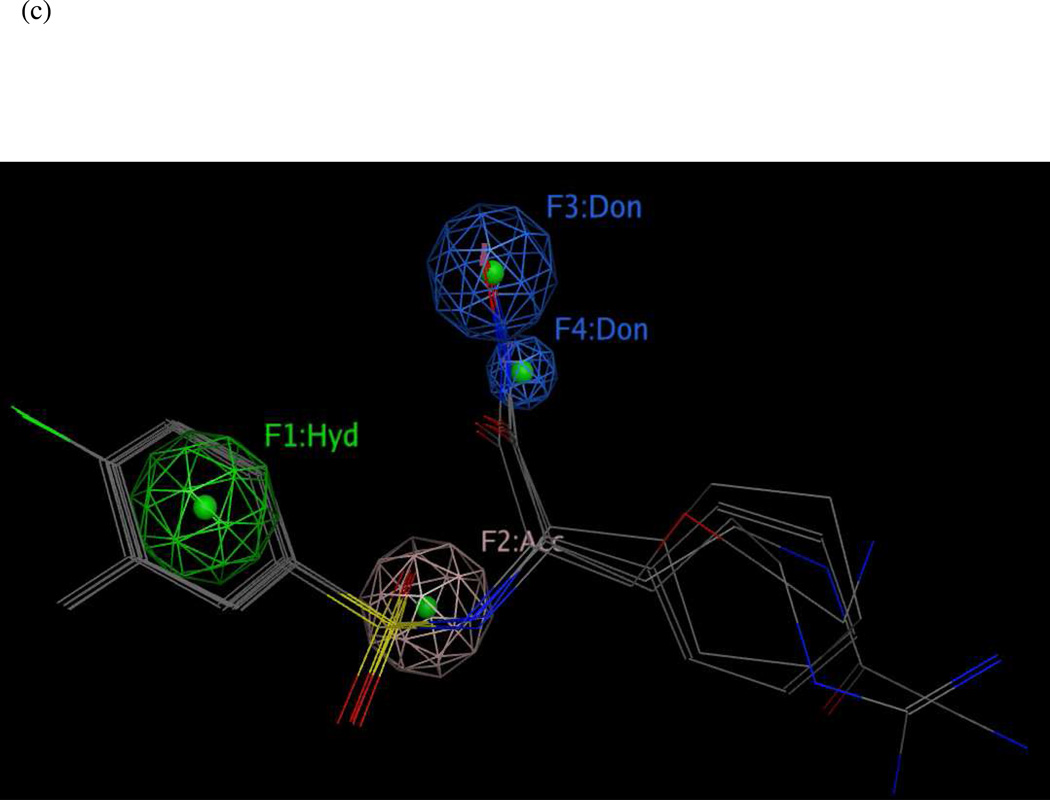
Figure 4.
(a) Ligand-receptor interaction diagram of sulfonamide hydroxamate MK-702 (LF-1B, 40) cocrystallized with the anthrax toxin lethal factor (1YQY.pdb55) (MOE 2010.10, Chemical Computing Group, Inc.). In this and subsequent MOE interaction diagrams, green spheres = “greasy” residues; spheres with red outline = acidic residues; spheres with blue outline = basic residues; spheres with black outline = polar residues; blue background spheres = receptor exposure to solvent; blue spheres on ligand atoms = ligand exposure to solvent; green dotted lines = sidechain donors/acceptors; blue dotted lines = backbone donors/acceptors; purple dotted line = metal contact; grey dotted line = proximity contour. (b) Additional ligand-receptor interaction map of MK-702 (LF-1B, 40) bound to LF (1YQY.pdb55) (PoseViewWeb66); in this and subsequent PoseView interaction diagrams, dashed lines = directed bonds between protein and ligand; spline sections = hydrophobic contacts between ligand moieties and the indicated receptor residues. (c) Preliminary LF inhibitor pharmacophore model UA1 based on a series of highly active analogs of MK-7029; green sphere = hydrophobic features; blue spheres = hydrogen-bond donors; pink sphere = hydrogen-bond acceptor (visualized in MOE 2010.10).


