Figure 5.
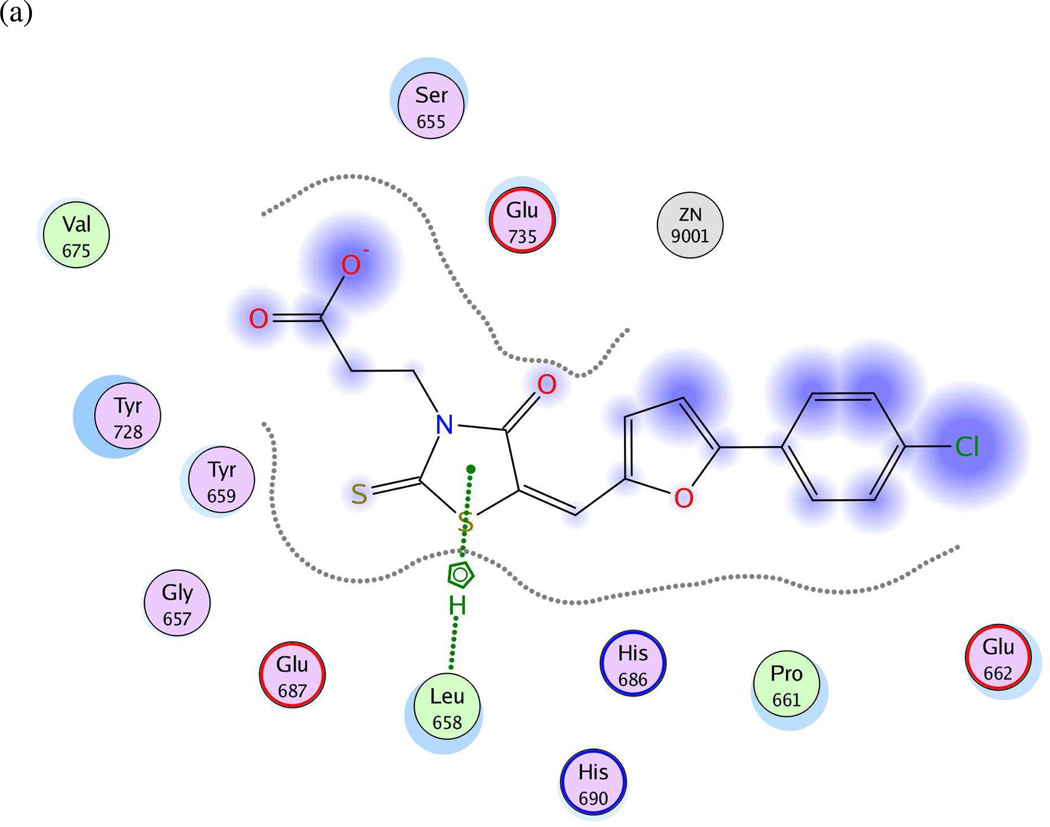
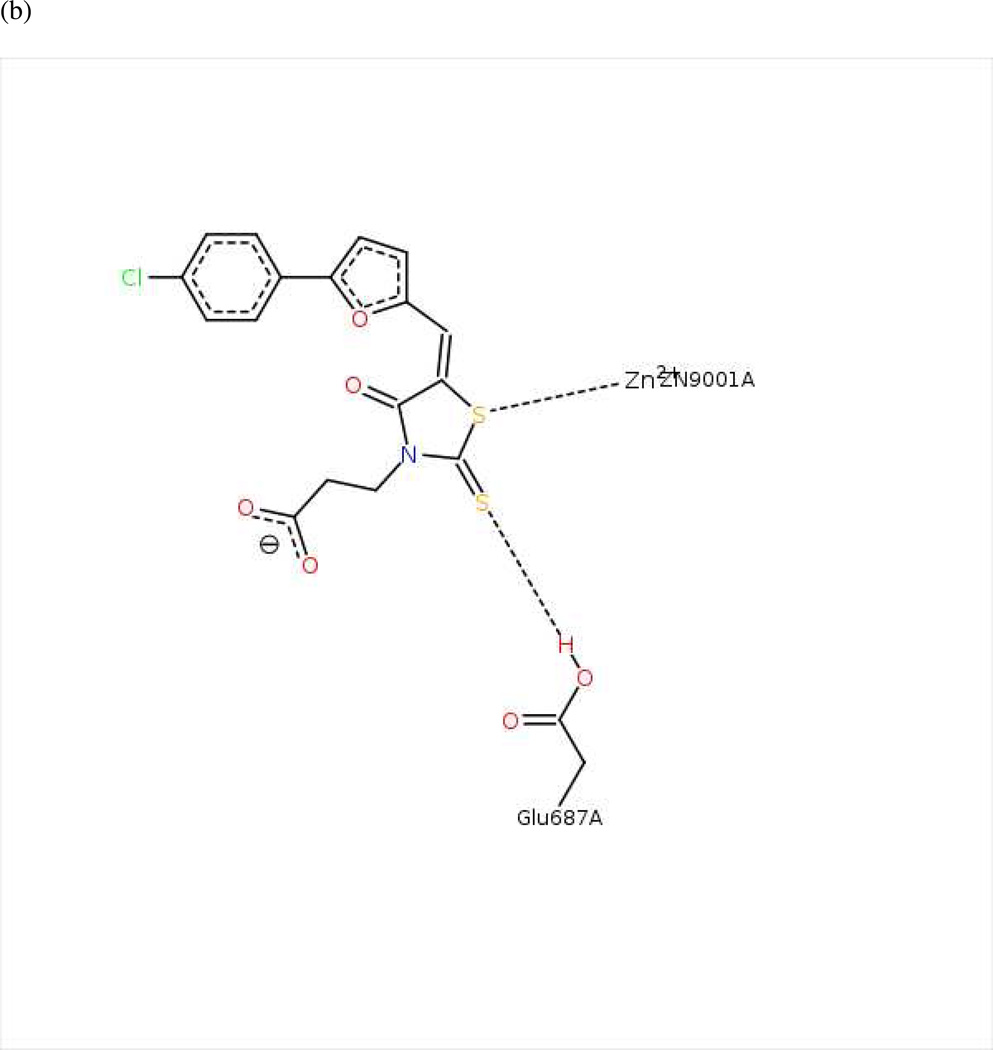
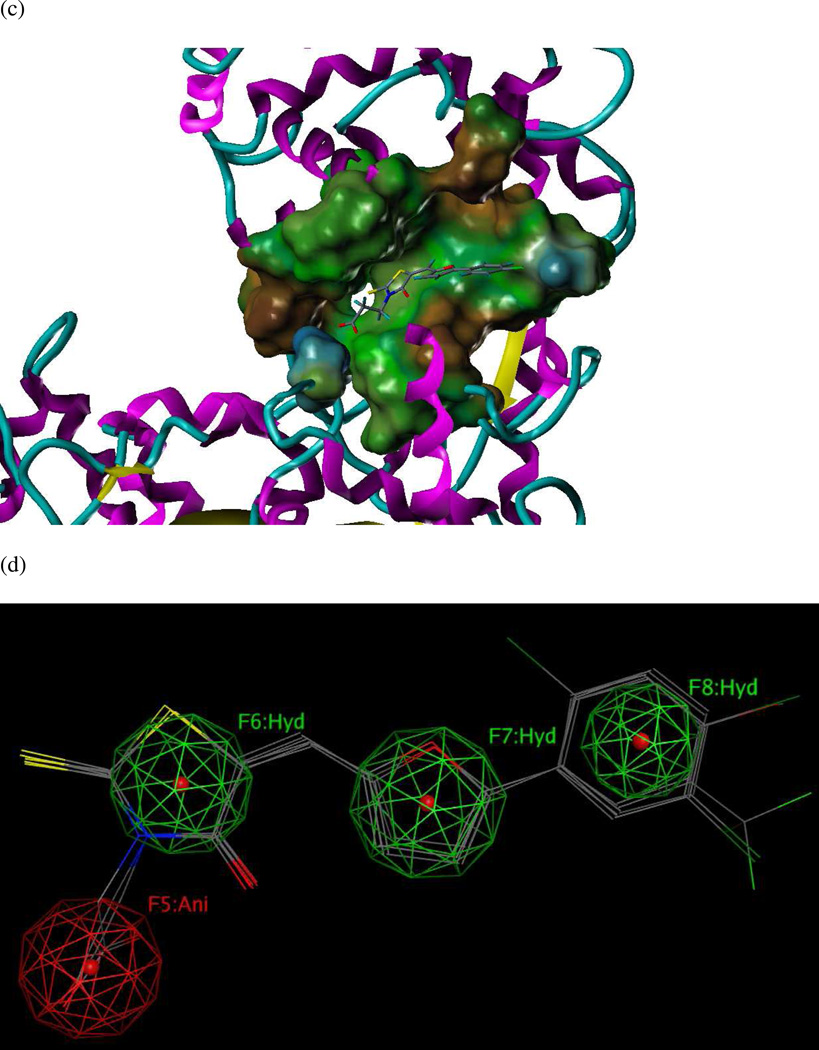
(a) Ligand-receptor interaction diagram of rhodanine derivative BI-MFM3 cocrystallized with the anthrax toxin lethal factor (1ZXV.pdb16) (MOE 2010.10). (b) Additional ligand-receptor interaction map of BI-MFM3 bound to LF (1ZXV.pdb16) (PoseViewWeb 66). (c) MOLCAD Fast Connolly electron density surface of the LF active site (1ZXV.pdb16) with lipophilic potential mapping, shown with BI-MFM3; brown = highest lipophilicity; blue = highest hydrophobicity (SYBYL 8.0, Tripos, Inc.). (d) Preliminary LF inhibitor pharmacophore model UA2 derived from three closely related rhodanine analogs24; green spheres = hydrophobic features; red sphere = anionic feature (visualized in MOE 2010.10).


