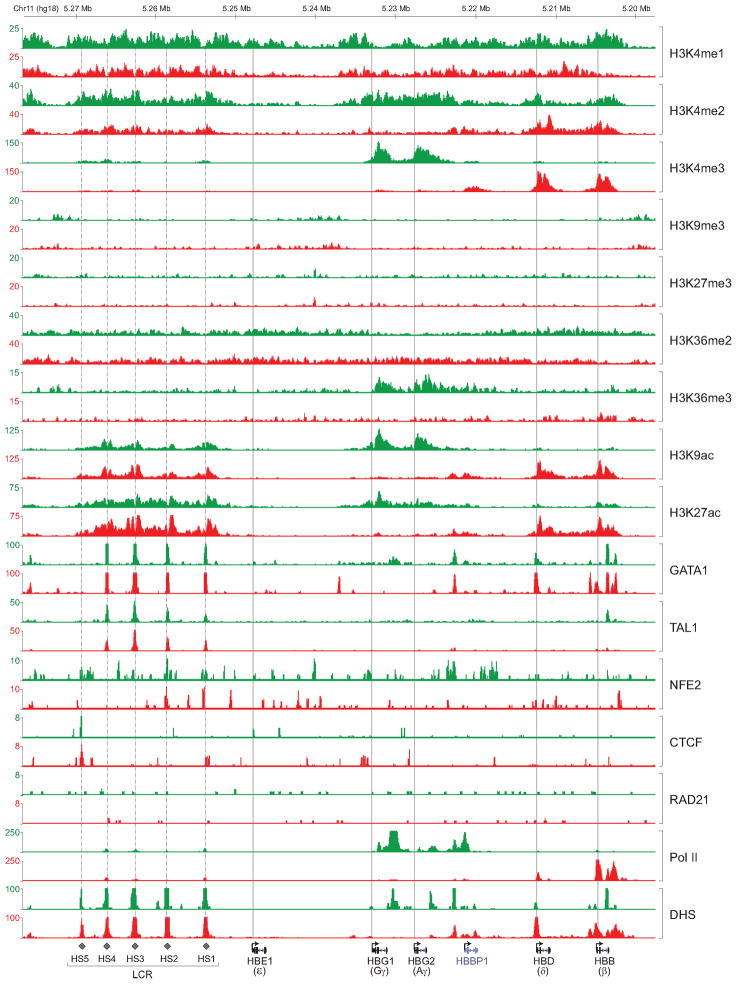
Figure 2. Chromatin State Maps and TF Occupancy within the Human β-Globin Gene Cluster.
ChIP-seq density plots were generated from raw read data and loaded into the UCSC genome browser as custom tracks. Profiles for histone marks, TFs, and DHS in fetal (green) and adult (red) ProEs are shown at the human β-globin gene cluster. The human β-globin locus is depicted at the bottom containing five β-like globin genes (ε, Gγ, Aγ, δ, and β). Dashed vertical line indicates the location of the upstream DHS (1–5) within the LCR. Solid vertical line indicates the TSS of each globin gene.

