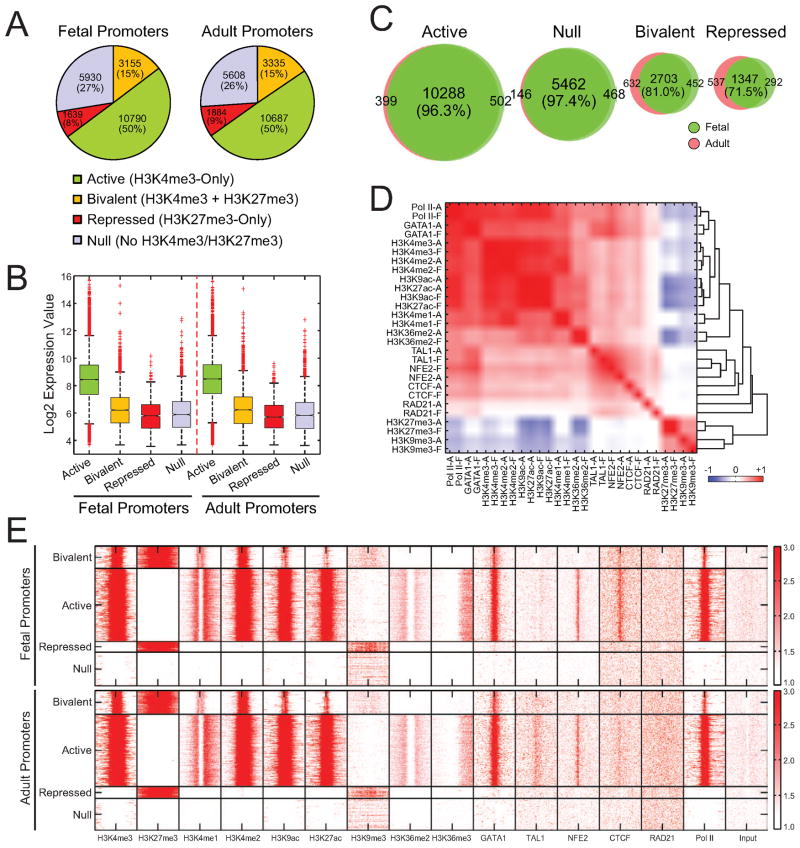
Figure 3. Promoter Activities in Fetal and Adult ProEs.
(A) Promoters were categorized into active, bivalent, repressed, and null promoters. The fraction of each promoter category is shown for both fetal and adult ProEs.
(B) mRNA expression values are shown for each promoter category in fetal and adult ProEs. Boxes show median line and quartiles. Whiskers show the boundary (1.5 times of the inter-quartile range from the first or third quartile) to define outliers (red dots).
(C) Venn diagrams show genome-wide overlaps between fetal and adult ProEs for each promoter category.
(D) Unsupervised hierarchical clustering of all ChIP-seq datasets within the proximal promoter regions (−2kb to +1kb of TSS) between fetal and adult ProEs. Heatmap depicting the Pearson correlation coefficient of ChIP-seq read densities of indicated TFs and histone marks is shown.
(E) ChIP-seq density heatmaps are shown for the profiled histone marks and TFs within each promoter category.

